
Big down day as stocks lose another 2%
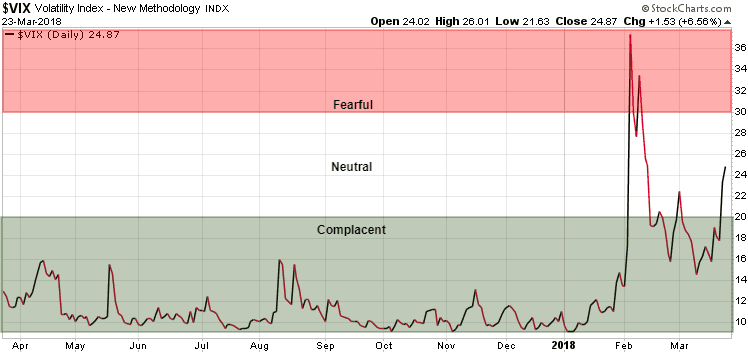
Let’s look at the volatility in the equity markets. The following chart shows the VIX Volatility Index. With the VIX Volatility Index a reading of under 20 indicates that investors are ‘complacent’, meaning a ‘risk-on’ sentiment, while a reading over 30 indicates investors are ‘fearful’ with a ‘risk-off’ sentiment. In the last couple of days the VIX has jumped almost 60%, moving out of the ‘complacent’ zone into a ‘neutral’ zone.
Now let’s look at the S&P 500 chart. The S&P 500 gained over 23% from mid-April to late-February, and then lost almost half those gains (over 10%) from February to current levels.
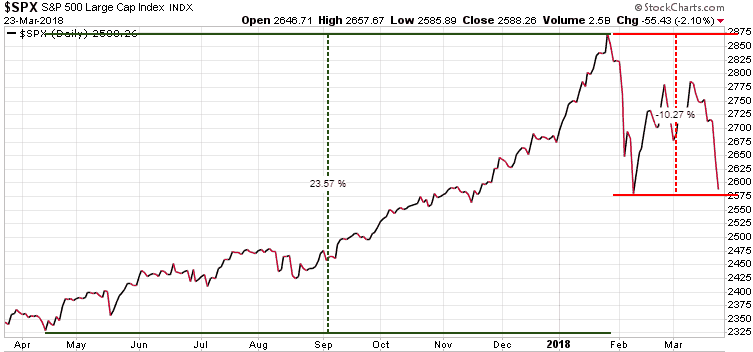
Unfortunately, most investors do not have an exit strategy and that is very dangerous, especially when we see severe market crashes. We always set SELL Stops to get out when the market turns against us. Another prudent strategy is to hedge your positions, with strategies that let you profit while the markets decline. Trend Technical Trader (TTT) is one of the best hedge services that we have ever seen, and its equity hedge strategies have gained over 55% since the market high in January. While the S&P 500 has lost over 10% since the January high, TTT’s equity hedge positions are up an average of over 55% in that same time.
This bull market in stocks has been running for over 9 years, and it is going to end sometime. In the very best-case scenario, we are in the late innings of this bull market, suggesting that a sizable correction is coming. Be sure you are protected!
We have extended our Special Offer to make it easier for you to get TTT’s strategies for a correction, and especially for a full-on crash. It’s your money – take control! Save $250 off the regular price of $649.95, and get TTT’s daily updates on the markets for only $399.95. Click here to take advantage of this offer.
Stay tuned!