Posts by The Trend Letter

China leading the charge for electric cars

Last year China sold over 28 million vehicles, more than any country in the world. China sold over 10 million more vehicles than the 17.6 million sold in the US.

Of the 28 million vehicles sold in China in 2016, 507,000 were Zero Emission Vehicles (ZEV), which was a 53% increase from 2015. By contrast, in 2016 Europe sold 222,200 ZEVs, 14% higher than 2015, while the US sold 157,000 ZEVs, 36% more than 2015.

Although China already sells more ZEVs than the US and Europe combined, they want to drastically increase these numbers. ZEVs represent about 1.8% of all vehicles sold in China last year. The government has now proposed aggressive targets of 8% ZEVs in 2018, and then 12% in 2020.

These are very aggressive targets, ones that have the auto-industry very concerned that these targets a far too ambitious. Whether or not they enforce these targets, it is clear China is serious to move its people to ZEVs versus the internal combustion engine (ICEs).

To understand why China is so motivated to lead the world toward electric vehicles (EVs) and plug-in hybrid electric vehicles (PHEVs), the simple answer is that they really have no choice.  Expanding ICE vehicles would mean that China would continue to be heavily energy dependent on from foreign sources. A second and more obvious reason is the terrible air pollution problems in China. Below is a picture of the smog outside Tiananmen Square in Beijing.

Today, China is the world’s largest auto market and represents most of the new worldwide demand for autos. There are 1.3 billion people in China, and it is a population the is rapidly seeing a rise in per capita incomes, which is creating  demand for personal transportation that cannot be met in an environmentally sustainable way using traditional technologies.

Already the world’s largest auto market, China’s 28 million vehicles sold in 2016 is expected to grow to 40 million by 2025. In the US, there are 260 million vehicles and 325 million people. That means that there is a vehicle for 80% of the entire population. In China there is a vehicle for only 16% of the population. While China may never catch up the the percentage of vehicles to people in the US, they are certainly going to close the gap, and lead the world in ZEV purchases going forward.

Stay tuned!

Headlines – August 8/17

  • Wall St opens lower as investors pause after record rally. Read story
  • Prosecutors seek 12-year sentence for Samsung boss. Read story
  • Americans now have the highest credit card debt in US history. Read story
  • Specter of coup, serge in violence haunt Venezuela. Read story
  • The two industries that are getting the worst customer complaints. Read story
  • Bitcoin soars to new record high. Read story
  • Study finds the aging US workforce is bad for productivity. Read story
  • Pilotless plane tests face resistance. Read story
  • Canada tax changes could push small business rate to 93%. Read story
  • Multi-level marketing companies like LulaRoe are forcing people into debt and psychological crisis. Read story
  • Macron backpedals on creating First Lady status. Read story
  • Why Germans pay cash for almost everything. Read story
  • Google fires “anti-diversity” memo author. Read story
  • Spike Lee to rally for Colin Kapernick at NFL HQ. Read story
  • On the lighter side. Check it out!

Stay tuned!

Is the stock market about to hit a seasonal decline?

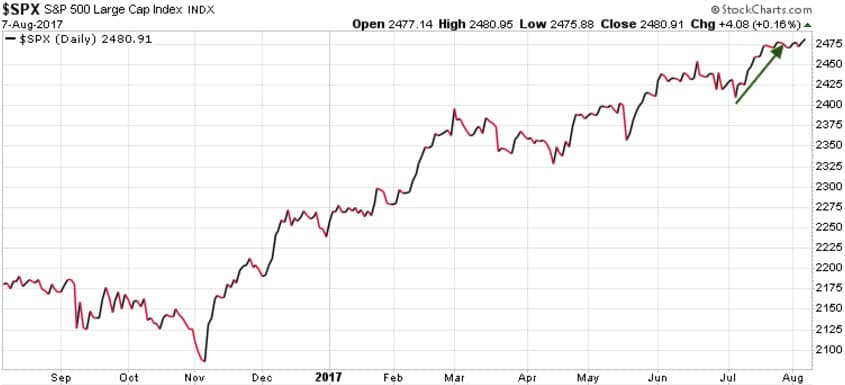
Generally, the well-known trading adage “Sell in May and go away” works, as long as you re-enter the market at the right time. This year however, the markets have been strong and are higher today than they were in May, driven primarily by the strong rally in July.

SPX0807

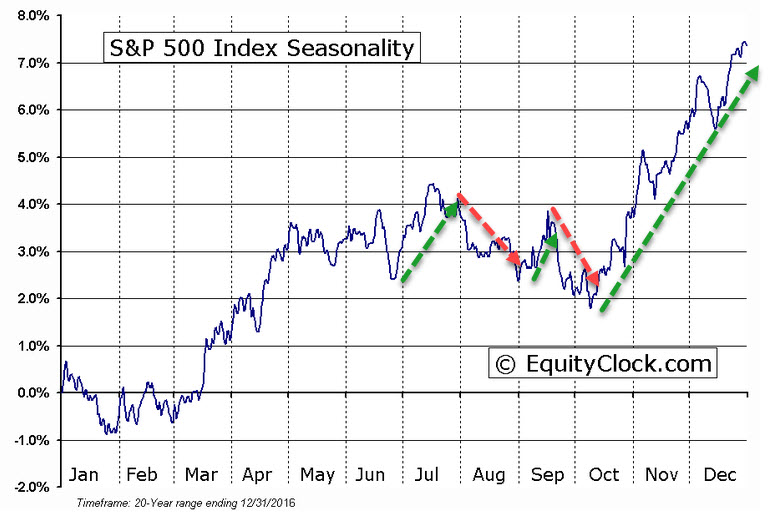
As we can see on the Seasonality Chart below, a July rally is the norm, not the exception. Based on data from the past 20 years, it is the month of August that typically sees a strong correction. September tends to follow with a rally to start the month, then sell-off into October. It is mid October where we generally see the market pick up again, with a year-end rally.

S&PSeasonality

We are still long, but just entered an “insurance” trade in case we do get that seasonal correction heading into September.

Stay tuned!

Headlines – August 4/17

  • Dow opens at record after strong July jobs report. Read story
  • The jobs numbers: Who’s hiring in America – and who’s not. Read story
  • Former Facebook executive says society will collapse as robots will put half of humans out of work. Read story
  • Gold falls, tracking weekly loss, as hiring strength in July boosts stocks and dollar. Read story
  • Toyota and Mazda team up to invest $1.6 bln in new US auto plant. Read story
  • Five big housing bubbles in five years. Read story
  • Venezuela currency crashes, down 94% in a year. Read story
  • US Congress sinks to 10% approval rating. Read story
  • EU to impose more sanctions against Russia. Read story
  • Chinese chatbots apparently re-educated after political faux pas. Read story
  • A futuristic ride in Mercedes’ new self-driving car. Read story
  • Why the beat up dollar is poised for a ‘rip-your-face-off rally’. Read story
  • The secret ingredient that makes the Mediterranean Diet work is money. Read story
  • On the lighter side. Check it out!

Stay tuned!

Headlines – August 3/17

  • Trump: US-Russia relations at ‘dangerous low’. Read story
  • Trump’s heated conversations with Mexico, Australia’s leaders revealed in transcript. Read story
  • Venezuela election results ‘manipulated’ by at least 1 million votes, polling company says. Read story
  • Small business hiring rises in July. Read story
  • WikiLeaks releases documents on ‘Dumbo’ CIA tool allowing control of webcams. Read story
  • ISM service index slows to 11-month low in July. Read story
  • Half of Detroit’s 8 mayoral candidates are felons. Read story
  • GOP clash looms over rising debt ceiling. Read story
  • Tesla’s revenue doubles, but losses also grow. Read story
  • The hackers behind WannaCry ransomware attack have finally cashed out. Read story
  • South African Airways ‘is on the verge of bankruptcy.’ Read story
  • Here’s who will pay for America’s crumbling infrastructure. Read story
  • This music production tool is the reason why all new music sounds the same. Read story
  • On the lighter side. Check it out!

Stay tuned!

Total US debt: $1.05 million per taxpayer

If you are an American citizen who pays taxes, your liability of the total US debt now totals $1.05 million.

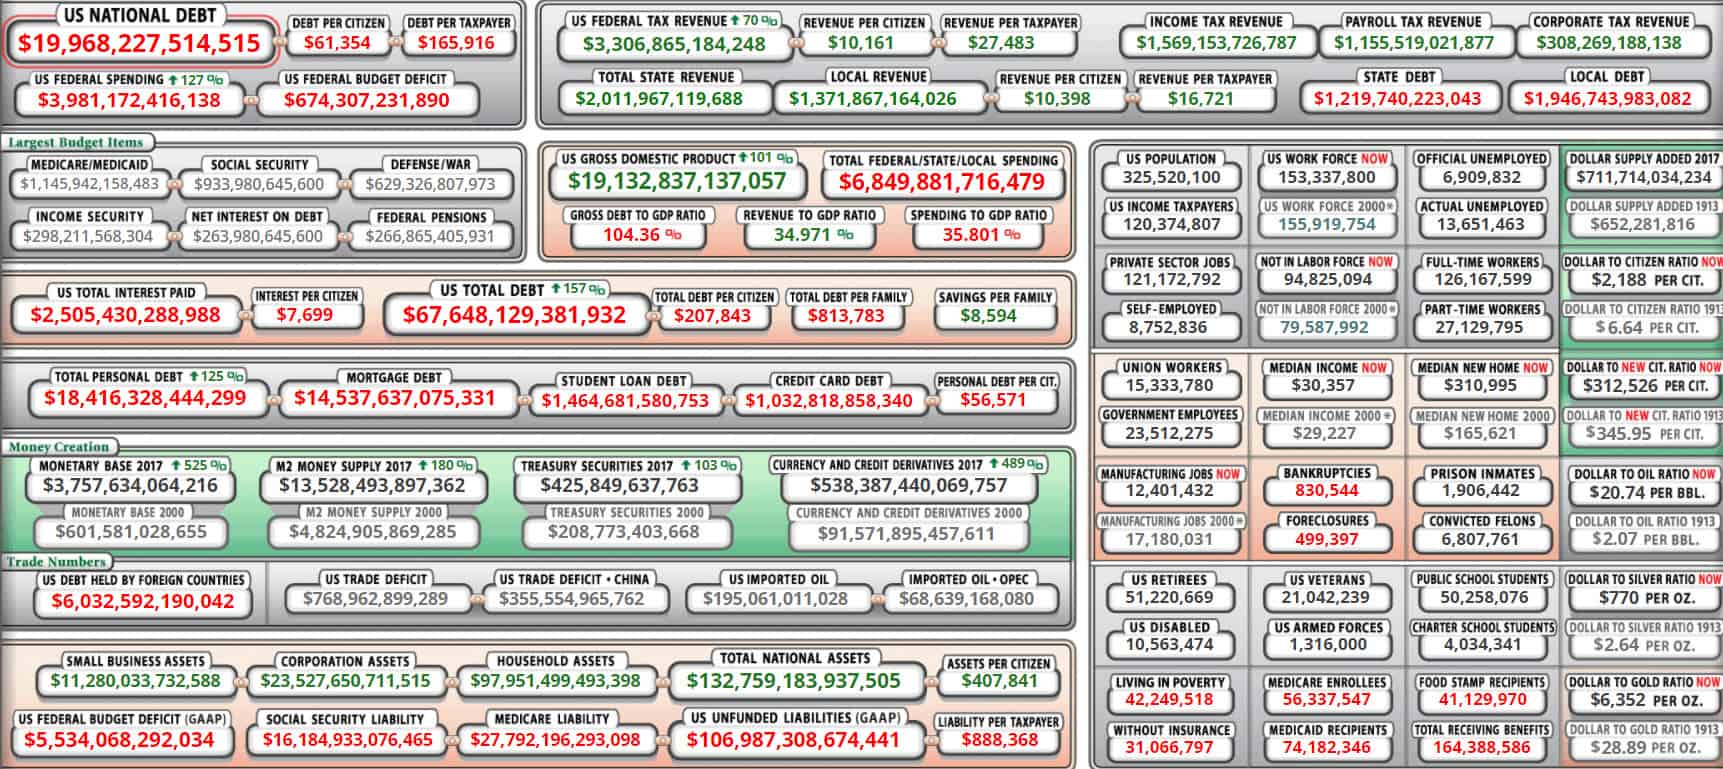
When discussing the national debt, most people assume that the total national debt is the ‘official’ debt, which is sitting at $19.98 trillion, which in itself is an outrageous number.

The current population in the US stands at 325 million, so that $19.98 trillion debt works out to $61,476 per man woman and child. But of that 325 million people  only 120 million ,or 37%, actually pay income tax. So if we were to divide the national debt by the number of people who pay income tax, it works out to $166,500 per taxpayer.

But this figure only covers the ‘official’ national debt, it does not include the federal government’s long-term unfunded liabilities – money the government is obligated to pay over and above the revenues it is estimated to receive. These liabilities include  Social Security, Medicare, Federal Employee and Veterans benefits. When you add it all up, the total of US government unfunded liabilities is $106.98 trillion.

When we divide the unfunded liabilities by the number of taxpayers it equates to $891,500 per taxpayer. Add the $166,500 per taxpayer for the ‘official’ national debt, and each taxpayer currently has a liability of $1.05 million. And this does not include all the municipal, and state debt that is also out of control.

Every level of government in the US is running large deficits, resulting in massive debts. The only sources of revenue for these governments are taxes and fees. So if you own property and are a taxpayer, expect to see all forms of taxes and fees continue to rise.

Click here to see a live, rather frightening, but very real picture of the US debt situation.

Stay tuned!

Debtclock

S&P 500 update: Watch for resistance at 2490-2515

Mariam Webster’s definition of Complacency:  marked by self-satisfaction especially when accompanied by unawareness of actual dangers or deficiencies :  marked by complacencyself-satisfied a complacent smile

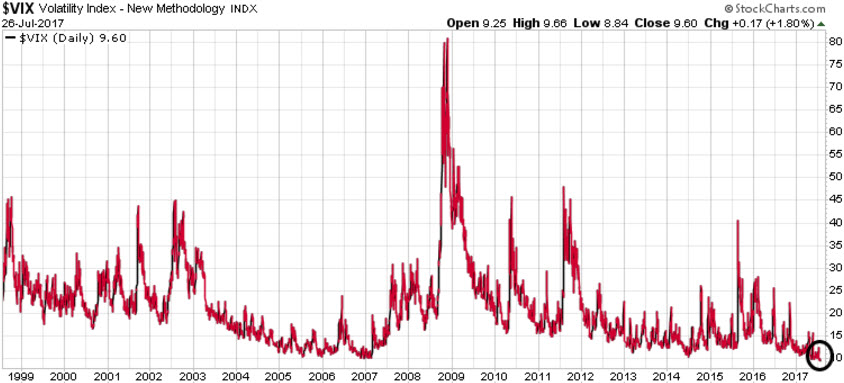
The VIX volatility Index measures the market’s expectation of 30-day volatility. It is constructed using the implied volatilities of a wide range of S&P 500 index options. This volatility is meant to be forward looking, is calculated from both calls and puts, and is a widely used measure of market risk, often referred to as the “investor fear gauge.”

A VIX reading above 30 indicates that investors are nervous, fearful, and risk-averse, concerned that the markets will decline. While readings under 20 indicate that investors are complacent, risk-tolerant, and optimistic that the markets will run higher. As we can see on the VIX charts below, investors are more complacent/optimistic today than at almost any other time in history.

VIX0726

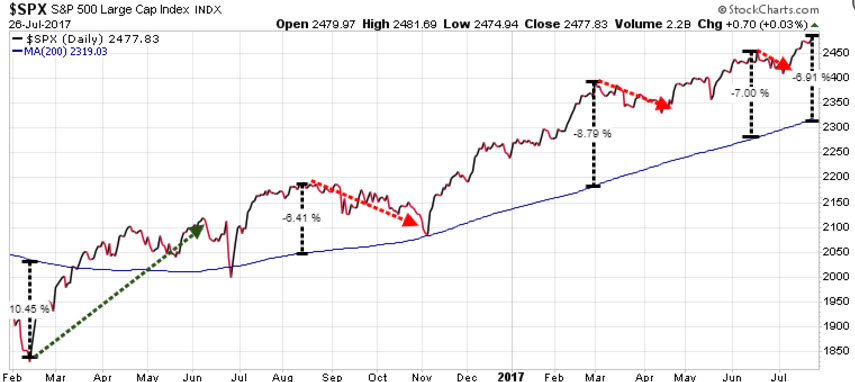
Another indicator that we need to pay attention to is that the S&P 500 seldom deviates more than 7% from its 200-day Moving Average. As we can see on the following chart, once the S&P 500 deviates up or down more than 7%, we tend to see a correction the other way. Today the S&P 500 is trading at 6.91% higher than its 200-day MA, suggesting a correction is coming.

S&P0726

In January we noted that once the S&P 500 closed above 2300 that 2500 was the next target. We identified the 2490-2515 range as a Key Resistance level for the S&P 500. With the S&P 500 currently trading just south of 2480, we are getting close to a strong resistance area for the markets. We would expect to see a Near-term high for the S&P 500 in the next few weeks.

We have continued to ride the market’s methodical rise higher, but recently sent subscribers a new pending trade (our entry price has not yet been hit) to profit should the markets decline here.

Numbers to watch:

  • 2490-2515 Near-term high
  • Potential for a quick decline to 2400-2415
  • A breach of 2400, although not expected, opens the door for a further decline to 2300
  • After declining to 2400, look for a new rally through 2500, then 2650
  • Another decline from 2650 to 2500
  • Then a year-end rally to close the year between 2700-2900

Subscribers to The Trend Letter will receive Flash Alerts when our model signals new buying opportunities.

Note: If you are not a current subscriber and want to get on the list to receive all of our weekly reports + our Flash Alerts, we our offering you a very Special Offer to receive The Trend Letter for only $369.95, a $230 discount off our regular rate. Click here to take advantage of this Special Offer.

Stay tuned!

Oil update: Patience required

Oil rallied 3.3% today, marking the strongest single-day rally since late last year. Reasons given for the rally were that Saudi Arabia announced that they would cut August exports to 6.6 million barrels a day—a million barrels less than a year earlier.

Also, Nigeria, which isn’t part of the production-cut agreement led by OPEC, promised to limit its daily production to 1.8 million barrels.

As with every bit of good news, speculators jumped in with both feet, continuing to buy every dip. While we have forecast a strong bull market for oil starting in 2018, we strongly suspect that this is yet another bear market bounce.

While traders took these developments as “bullish” for oil prices, we must highlight that the Saudis normally lower exports at this time of year because of stronger domestic demand for oil. Also, Nigeria’s current level of production is just over 1.6 million mb/d, meaning that Nigeria’s production will rise another  200,000 b/d before it would reach its 1.8 mb/d cap.

It is true that US oil stocks are declining, but this is the summer “driving season” when oil stocks always decline as refinery utilization rises to meet the demand from the summer drivers.But even though we are seeing stocks decline, the current level is still over 110 – 150 million barrels higher than the previous normal range.

USendingstocks0723

Once this summer “driving season” ends in 6 weeks, we will see demand wane, and then we expect to see oil prices see their final decline in this painful phase of the oil price cycle.

Another factor that the speculators are either ignorant of, or they are simply ignoring, is that US production continues to rise. The The US Energy Information Agency (EIA) has forecast that US production will reach 10 million barrels per day in 2018, the highest level ever!

USoilprod0723

We believe that those who show patience and hold plenty of cash will be in a terrific position to jump in when we hit the table pounding buying opportunity, likely late 2017, early 2018.

Note: Subscribers to The Trend Letter will receive Flash Alerts when our model signals those great buying opportunities.

We do see a new bull market for oil, and for most of the commodity sector. The energy sector performs very well during commodity booms, and we expect great gains, once we work through the last phase of this liquidation.

We will discuss some of the reasons for our longer-term bullish view next week.

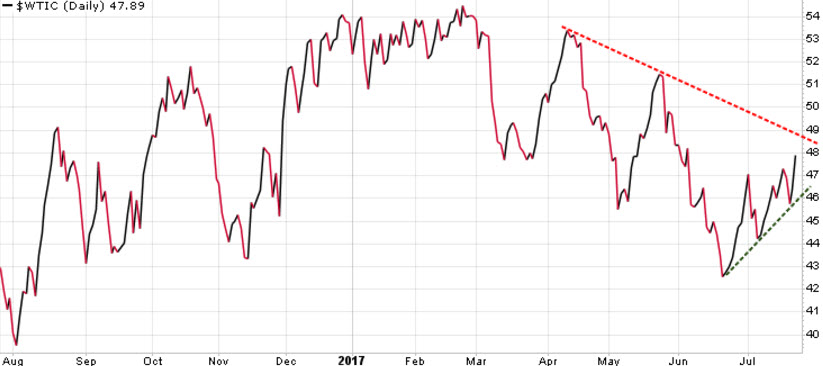
For now be patient and wait for our table pounding BUY Signal! We expect to see the oil price to drop below 40.00, into the low to mid 30.00 range before we get our buying opportunity.

wtic0725

Note: If you are not a current subscriber and want to get on the list to receive all of our weekly reports + our Flash Alerts, we our offering you a very Special Offer to receive The Trend Letter for only $369.95, a $230 discount off our regular rate. Click here to take advantage of this Special Offer.

Stay tuned!

Illinois – the canary in the coal mine

A few months ago, we highlighted how Illinois was broke and that it would soon be the first state to have a junk bond rating. After all, the state has gone over two years operating without a budget.

The state is in shambles, running up $15 billion in unpaid bills, and according to CNN Money Watch, Illinois’ unfunded pension liabilities increased 25% in one year to over $250 billion.

In an attempt to raise revenues, the state officials did what all politicians and bureaucrats do, they raised every form of tax and fee possible. In fact, their proposed solution to overcome their $6 billion budget deficit is to raise taxes by $5 billion, or $1,125 per household per year.

The problem there is that people are leaving Illinois in droves. In 2016, almost 90% of all Illinois counties saw their population shrink. For the third year in a row, Illinois leads the US with the number of residents leaving the state. The population of Illinois is now the lowest it has been in a decade.

It is not just residents that are leaving, as businesses say they are being hit with a perfect storm of regulations and tax hikes this summer, putting a damper on hopes for business expansion and jobs growth.

“Earning a profit is getting to be a dirty word,” Mark Grant, Illinois state director of the National Federation of Independent Business, told Illinois News Network.

In her frustration with lawmakers, the state’s comptroller Suzana Mendoza stated…

“I don’t know what part of ‘We are in massive crisis mode’ the General Assembly and the governor don’t understand. This is not a false alarm.”

States are not like Federal governments who can print money out of thin air. States are more like real businesses in that they must balance their budgets as there is only so much money and credit available.

Illinois is the canary in the coal mine. It is an early warning that governments have made outlandish promises to workers in the form of unsustainable pensions funds, and these obligations can never be met.

Puerto Rico had a similar scenario a few months ago, basically they were bankrupt. Illinois is the second alarm in the US, and there will be many more to follow.

Politicians and government officials all over the globe have made promises that can never be met. The winners are those who get to collect on those promises right away, while the losers are those who are stuck with the bills long after the politicians have retired on their pensions.

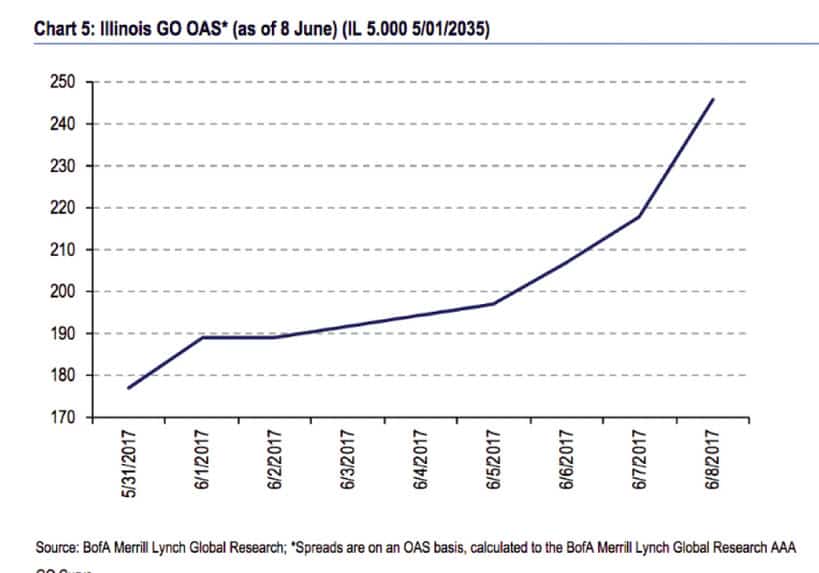
For Illinois, the problems just magnify. By mismanaging their budgets for so long, investors are now fleeing Illinois bonds. This has caused a sharp spike in bond spreads on Illinois general obligation bonds, making it costlier for the already cash-strapped state to borrow.

Illinois bonds

The state’s pension crisis threatens to burden taxpayers with massive, ever-escalating taxes to bail out a system that is simply not sustainable. And every day Illinois goes without a solution to its pension crisis, the state’s pension debt grows by over $20 million.

And Illinois is not alone, this problem is widespread. Later we will show how big the US federal liabilities problem is.

Over three years ago we warned of a global debt crisis that would devastate most investors. That crisis is now underway. Understand what is unfolding, and have a plan to protect your family”s financial future.

Stay tuned!

Headlines – June 21/17

  • China stocks win MSCI inclusion; initial market reaction muted. Read story
  • Uber CEO Travis Kalanick resigns under investor pressure. Read story
  • Oil headed for weakest first-half performance in two decades. Read story
  • S. Korea says crashed N. Korea drone ‘grave provocation’. Read story
  • Villian of the housing crash makes a comeback. Read story
  • The dark side of China’s national renewal. Read story
  • Russina defense minister’s jet buzzed by NATO jets. Read story
  • Brexit one year after vote: Here are 5 possible scenarios for the EU divorce. Read story
  • Saudi king ousts nephew for son as Crown Prince. Read story
  • Wimbledon winner Boris Becker declared bankrupt. Read story
  • 38% of Americans less winning to attend large events due to terrorism. Read story
  • India’s oldest yogini says that you are doing yoga wrong if you are working up a sweat. Read story
  • On the lighter side. Check it out

Stay tuned!