
Market Notes – April 25/22
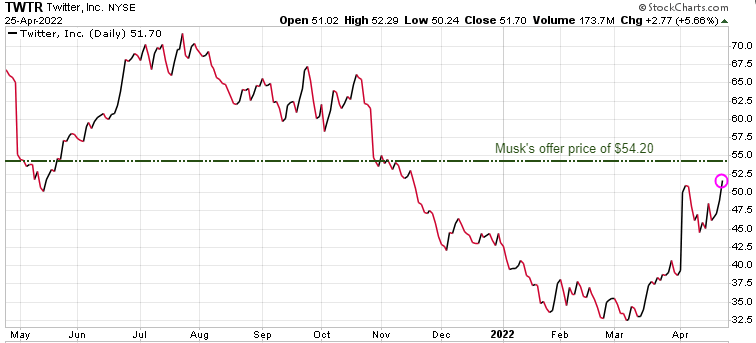
(AP News)…Elon Musk reached an agreement to buy Twitter for roughly $44 billion on Monday, promising a more lenient touch to policing content on the social media platform where he — the world’s richest person — promotes his interests, attacks critics and opines on a wide range of issues to more than 83 million followers.
The outspoken Tesla CEO has said he wanted to own and privatize Twitter because he thinks it’s not living up to its potential as a platform for free speech.
Musk said in a joint statement with Twitter that he wants to make the service “better than ever” with new features, such as getting rid of automated “spam″ accounts and making its algorithms open to the public to increase trust.
“Free speech is the bedrock of a functioning democracy, and Twitter is the digital town square where matters vital to the future of humanity are debated,” the 50-year-old Musk said, adding hearts, stars and rocket emojis in a tweet that highlighted the statement.
Musk’s offer is $54.20 for each share.
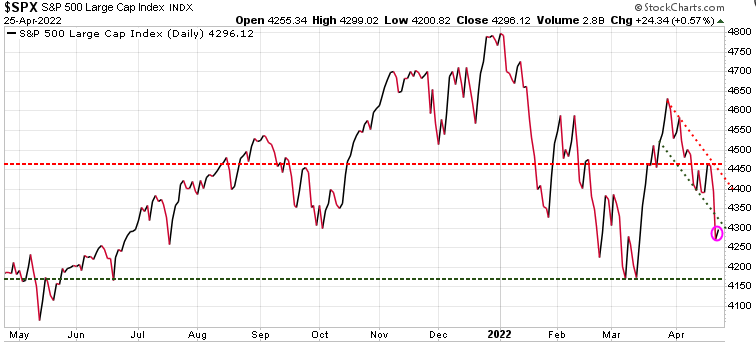
Wild swings for the equity markets today, with the S&P 500 tumbling at the opening where it bottomed at 4200, and then fought its way to a high of 4299, before closing near that high at 4296. In yesterdays’ issue of the Trend Letter, we told subscribers… ‘sentiment is very bearish, which to us can be quite contrarian, suggesting a possible relief rally, short-term is likely.’

Watch the 4470 level for near-term resistance, and 4600 for key resistance. Understand that with the Fed tightening its balance sheet, raising rates, and the yield curve inverting, a recession is extremely likely. The first step is for the S&P 500 to break out of its downtrend channel.
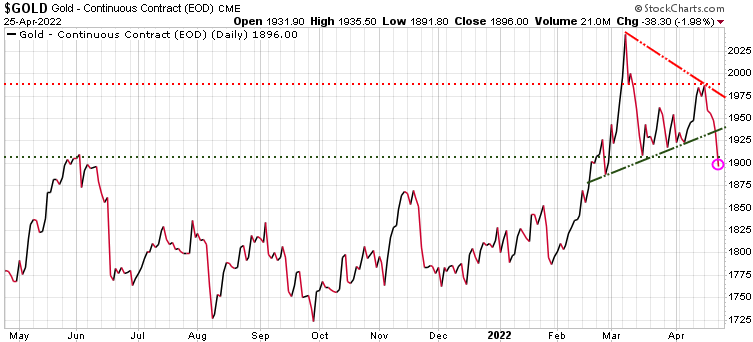
Gold had another disappointing day, closing down 38.38 on Monday. Gold has now lost 108.00 since the intra-day high last Monday.
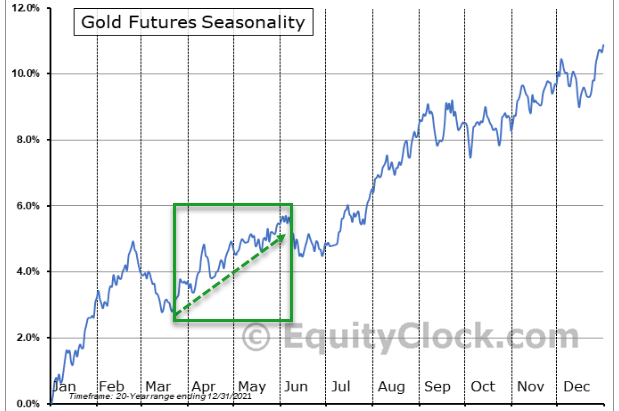
Based on seasonality, gold is in a strong period from late March through to early June. So far, that strong historic trend has not materialized this year.
Stay tuned!