Market Notes – June 17/22
For those wanting to jump in and ‘buy the dip’ be mindful of our constant warnings that ‘bear market rallies typically fail to make new highs, and instead often make new lows.’
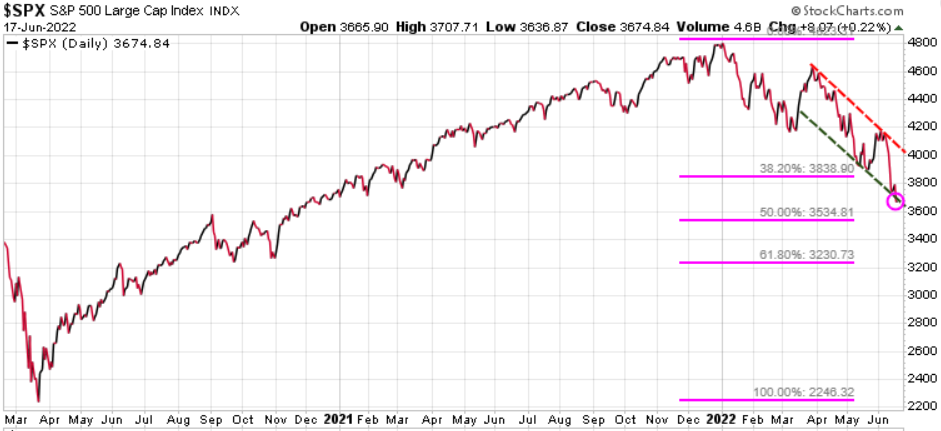
According to Bank of America ‘The average peak to trough bear decline = 37.3%, average duration 289 days; history is no guide to future performance but if it were, today’s bear market would end on Oct 19, 2022 (35-year anniversary of Black Monday) with S&P 500 at 3000.‘
The S&P 500 has dropped through the 38% fibonacci retracement level at 3838 and is approaching the 50% retracement at 3534.
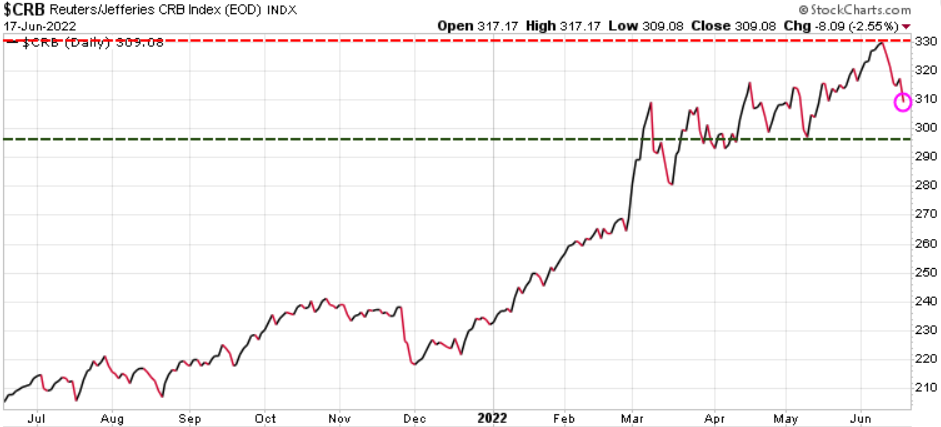
A few months ago we targeted mid-year as a potential top for commodities. We are seeing food, lumber, even gasoline and oil coming down this week. Could the top be in?
Here is the Reuter CRB Commodity Index and it has started to roll over. Watch the 296 level (green horizontal line), which was the May low; a break below that level would be bearish. Understand that long-term we are very bullish commodities, but if we are heading for a recession then commodities will be hit as well. Once the bottom is in, we will be sending out BUY signals to subscribers.
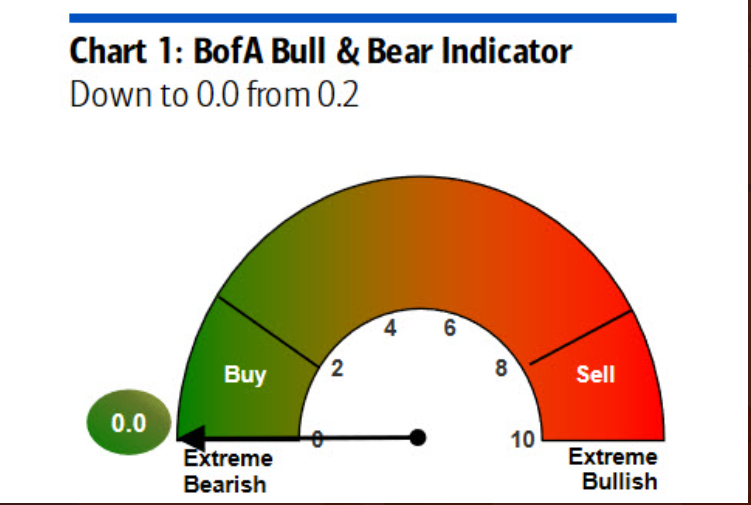
Michael Hartnett of Bank of America notes that Fed tightening ‘always breaks something’ with the US recession likely the last leg lower in this bear market. Looking at the their Bull & Bear indicator we can see that it has dropped right down to zero, which is quite extreme. This is a contrarian indicator suggesting one of those bear markets rallies should kick off next week.
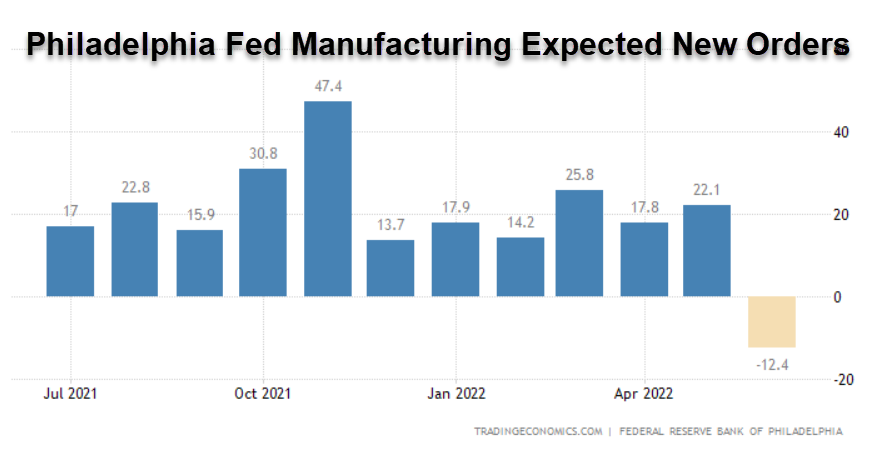
Another sign a recession likely coming as manufacturing took a big hit last month.
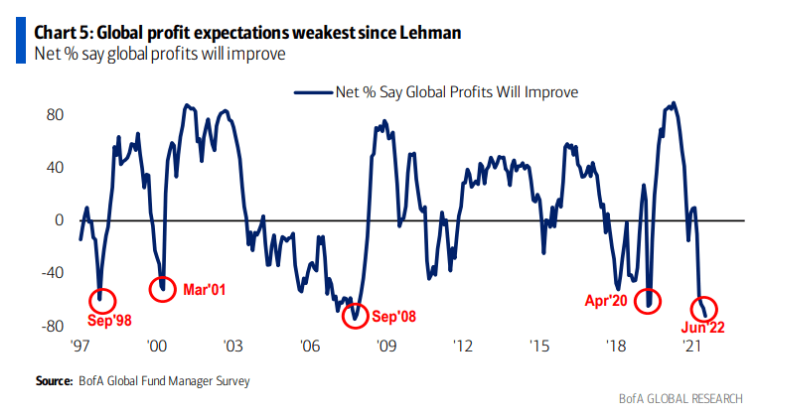
And yet another negative piece of news. ‘Global profit expectations among money managers are tumbling, another sign that Wall Street is at a crisis point’, according to BofA Securities. In their June Fund Manager Survey of 800 panelists with $834B under management, a net 72% say corporate profits will worsen, the lowest reading since the collapse of Lehman Bros. in September 2008.
There is a term called the ‘wealth effect.’ It refers to how homeowners and investors feel when housing prices and the value of their stock portfolios go up in value; they feel wealthy and therefore are willing to spend more. Consumers account for ~70% of the GDP, so when they spend more, it is good for the economy. Of course the reverse is also true, when house prices and stocks fall in value, consumers spend less and the economy slows.
Various indicators continue to portray extreme bearishness, which in a bull market would be a solid BUY signal. But, this is not a bull market, so we need to show caution here. If you have not yet put on any hedge positions, use this next relief rally to do so. Trend Technical Trader (TTT) uses simple inverse ETFs for hedging and offers subscribers many options; there is something for every investor. Click here to subscribe to TTT at a 50% discount