Market Notes – January 27/23
The S&P 500 added 0.2%, while the Dow Jones Industrial Average ticked up 0.08%. The technology-heavy Nasdaq Composite was up roughly 1%, closing out its best week since November.
The biggest mover on Friday were shares of Intel which fell as much as 10% on Friday after the company’s bleak outlook disappointed. Intel reported a quarterly earnings miss after the close Thursday, adjusted earnings per share coming in at $0.10 against the $0.19 expected by the Street. Revenue totaled $14.04 billion, below estimates for $14.5 billion.
Martin was on Mike Campbell’s Money Talks today (click here to hear that interview..starts at 39:00) and discussed a few charts that he shows his subscriber’s each week and that investors should be aware of.
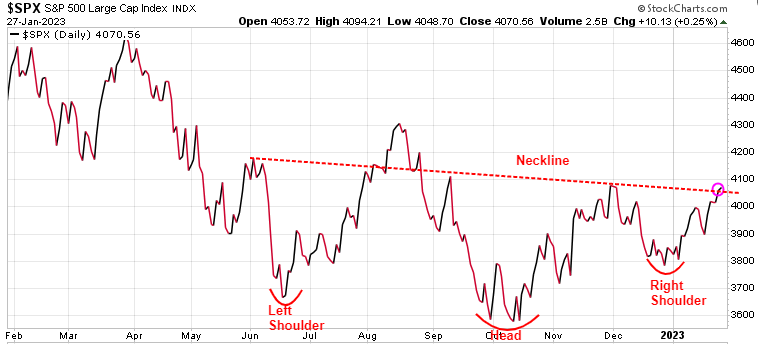
One of them is that the S&P 500 has displayed a reverse head and shoulder pattern since January and on Friday was able to push through the ‘neckline’ of that pattern, which is a bullish indicator.
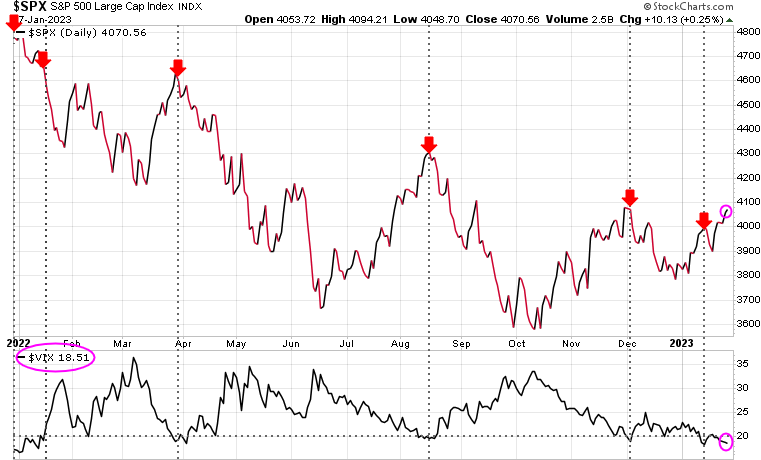
In the short-term, Martin talked about how when the VIX Volatility Index drops below 20.00, we typically see a temporary top in the market. Today it dropped to 18.51.
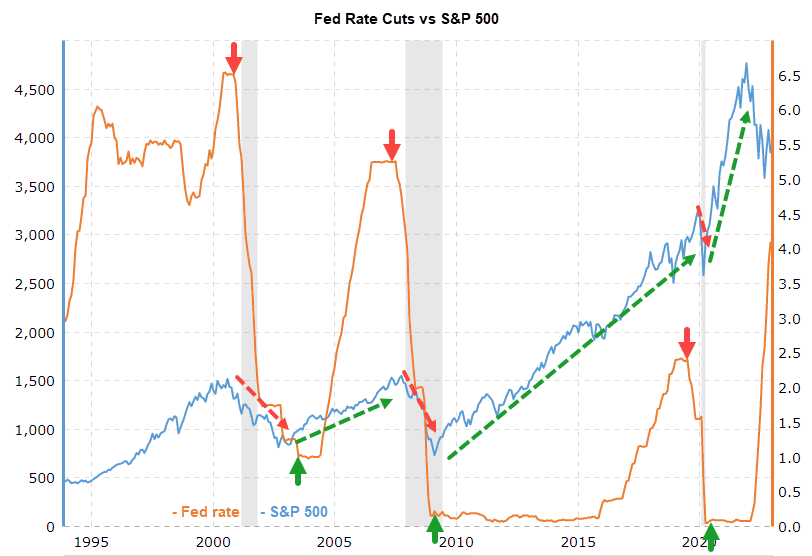
Another chart paints a much different picture than most investors hold. While all the noise is that the Fed will pause, then pivot & cut…so its BUY BUY BUY, there is a compelling chart that suggests that may not be the case. We have been showing our subscribers the following chart that shows when Fed is in a rate hike cycle like they are now, the bottom in the market aligns with when the Fed STOPS CUTTING rates, not STOPS RAISING them.
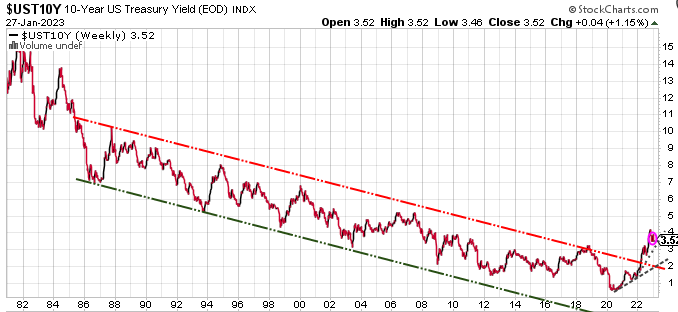
With bonds Martin talked about how the 40 year downtrend in yields has been broken.
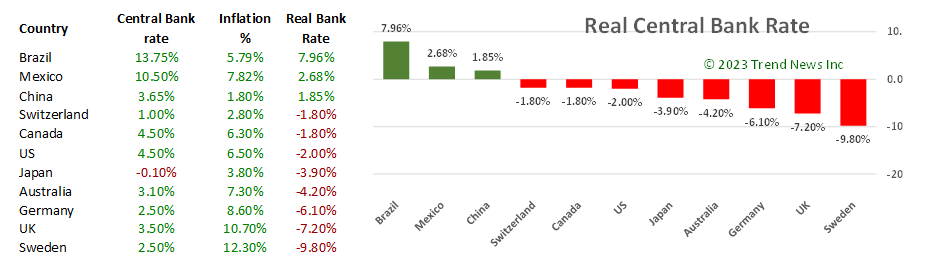
He also pointed out that both the Bank of Canada and the Fed say they want the REAL rate to be positive, meaning they want the Central Bank rate HIGHER than the inflation rate.
The Bank of Canada rate is 4.5%, the Canadian inflation rate is 6.3%, so the REAL rate in Canada is -1.80%. Therefore, if they are true to their word, then rates need to rise &/or inflation needs to drop to get a positive real rate.
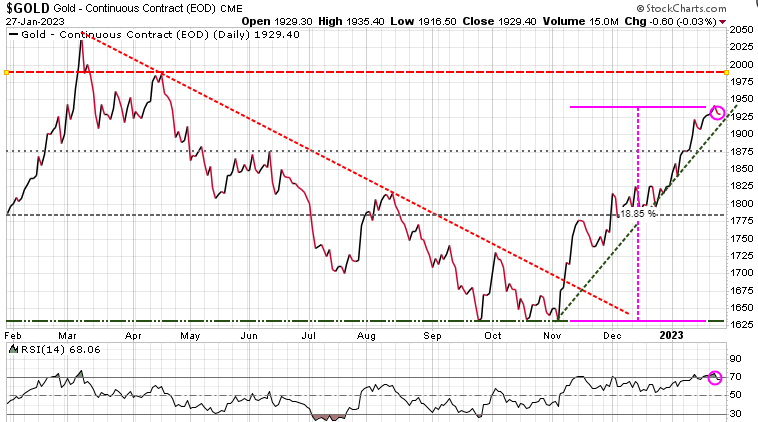
Back in November we told subscribers that gold was forming what we hoped would be a strong base foundation , and that turned out to be exactly what happened. Since that November low, gold has nicely broken through a series of our resistance targets at 1730, 1775, 1875, & 1910. Gold is up up almost 19% from that November low. Looking at the RSI (bottom of chart), gold is technically overbought here, so, we could see a retreat soon, with near-term support at 1875, with 1780 being a strong support level. Next resistance would be 1980
In the interview there was an offer for discounts on the regular rates. See below.
Trend Letter:
Since start-up in 2002 Trend Letter has provided investors with a great track record, giving exceptionally accurate information about where the markets are going, and it has explained in clear, concise language the reasons why. Using unique and comprehensive tools, Trend Letter gives investors a true edge in understanding current market conditions and shows investors how to generate and retain wealth in today’s climate of extreme market volatility.
A weekly publication covering global bonds, currencies, equities, commodities, & precious metals. Publishes every Sunday evening, covers equites, currencies, precious metals, commodities, and bonds. Each weekly issue is about 50 pages, mostly charts, with key bullet points to make easy to understand. A 10-15 min read
Timer Digest says: “Trend Letter has been a Timer Digest top performer in our Bond and Gold categories, along with competitive performance for the intermediate-term Stock category.”
Technical Trader:
Trend Technical Trader (TTT) is a premier hedging service, designed to profit in both up and down markets.
TTT isn’t just a hedging service. Its timing strategies have returned fantastic gains on the long side. See examples here
Included is our proprietary Gold Technical Indicator (GTI).
Trend Disruptors:
Disruptive technology trends will propel our future and the reality is that no industry will go untouched by this digital transformation. At the root of this transformation is the blurring of boundaries between the physical and virtual worlds. As digital business integrates these worlds through emerging and strategic technologies, entirely new business models are created.
Trend Disruptors is a service for investors seeking to invest in advanced, often unproven technology stocks on the cheap, with the objective to sell them when masses finally catch on. Covering Artificial Intelligence (AI), Virtual Reality (VR), Augmented Reality (AR), 5G, Quantum Computing & many more.
Special Offers
| Service | Regular Price | Special Price | Saving | Subscribe |
|---|---|---|---|---|
| Trend Letter | $599.95 | $349.95 | $250 | Trend Letter $349.95 |
| Technical Trader | $649.95 | $349.95 | $300 | Trend Technical Trader $349.95 |
| Trend Disruptors | $599.95 | $349.95 | $250 | Trend Disruptors $349.95 |
| Better Deals | ||||
| Trend Letter + Technical Trader | $1,249.90 | $549.95 | $699.95 | Trend Letter & Technical Trader $549.95 |
| Trend Letter + Trend Disruptors | $1,199.90 | $549.95 | $649.95 | Trend Letter & Trend Disruptors $549.95 |
| Technical Trader + Trend Disruptors | $1,249.90 | $549.95 | $699.95 | Technical Trader & Trend Disruptors $549.95 |
| Best Deal | ||||
| Trend Suite: Trend Letter + Technical Trader + Trend Disruptors | $1,849.85 | $649.95 | $1,199.90 | Trend Suite: TL + TTT + TD $649.95 |