
It’s All Connected: The Charts Behind My Latest Interview
This week I joined Jim Goddard on This Week in Money. We covered a lot of ground: oil, diesel, interest rates, bonds, currencies, gold, stocks and DeFi. On air, I promised listeners some charts so they could see what I was describing instead of trying to picture it.
Here they are, in the same order as the interview. Each section includes the timestamp so you can jump back to that part of the conversation.
The common thread is simple: it’s all connected. Oil pushed inflation up. Inflation pushed central banks to raise rates. Higher rates pushed bond yields to multi-decade highs. And those yields are now colliding with a mountain of debt.
[Listen to the full interview ]
1. Oil: a tug-of-war between supply and fear (9:00)
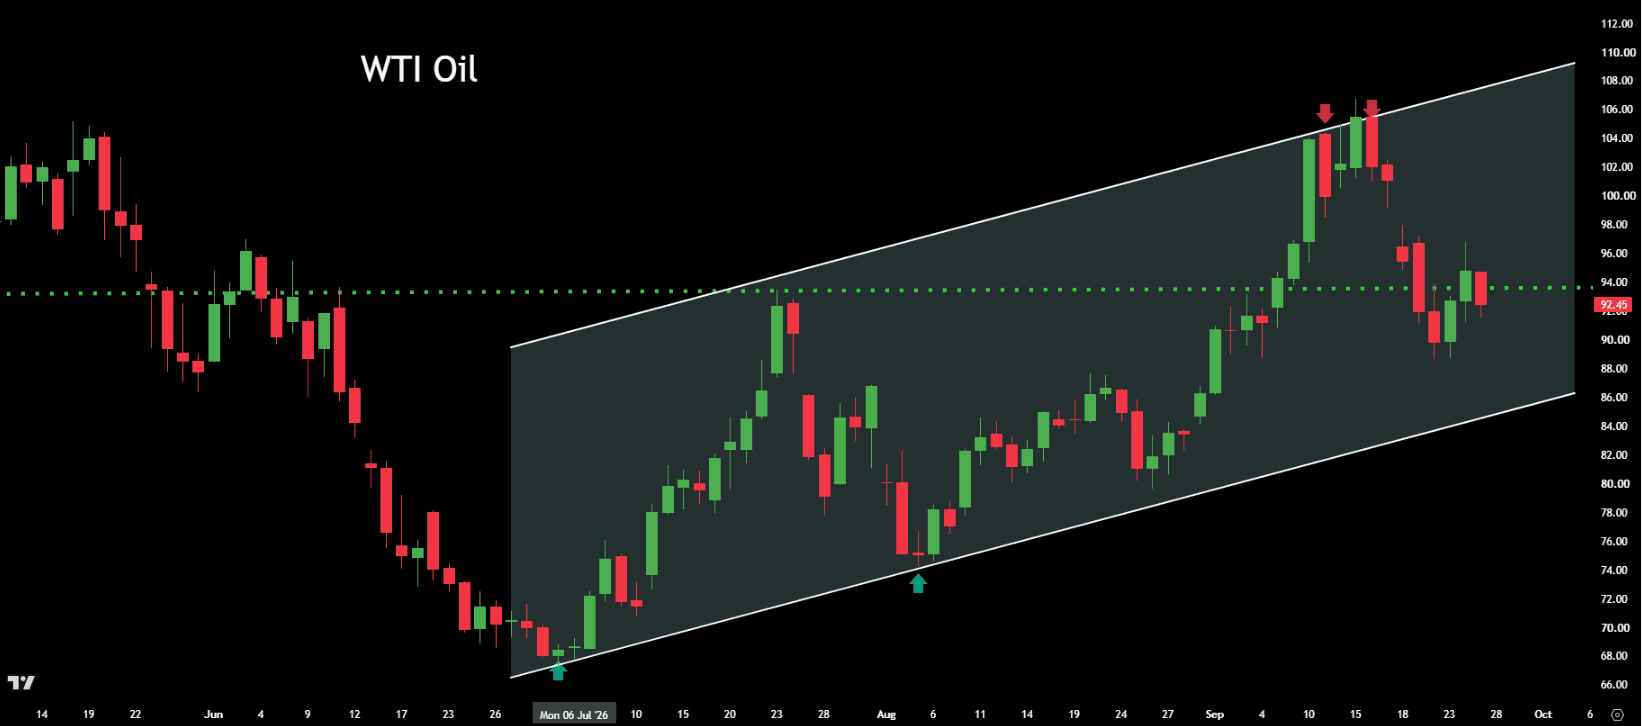
WTI crude, daily. Oil has been climbing in a rising channel since July. The green line is ‘support’, a level where buyers tend to step in. The red line is ‘resistance’, a level where sellers tend to take over. Oil was turned back at the top of the channel near $105 in mid-September and is now testing support around $92–93 (dotted line).
- Supply improved: Saudi Arabia restarted its East-West pipeline, which moves oil around the Strait of Hormuz. That extra supply initially pushed prices lower.
- Fear won anyway: Heated threats between the US and Iran at the UN General Assembly sent Brent up about 4% in a single day.
- The lesson: When supply is already tight, it doesn’t take an actual disruption to move prices. The fear of one is enough.
- Still disrupted: Traffic through the Strait of Hormuz is still running roughly 80% below normal. Libya’s output is offline, and Russian fuel exports are restricted.
- An analogy: Think of global oil supply as several pipes feeding one big tank. One kinked pipe (the Saudi pipeline) got fixed, but the threats traded between Washington and Tehran more than offset it.
- The election angle: With US midterms about six weeks away, high pump prices put pressure on Washington. Iran knows it.
2. Diesel: the bigger problem (13:29)
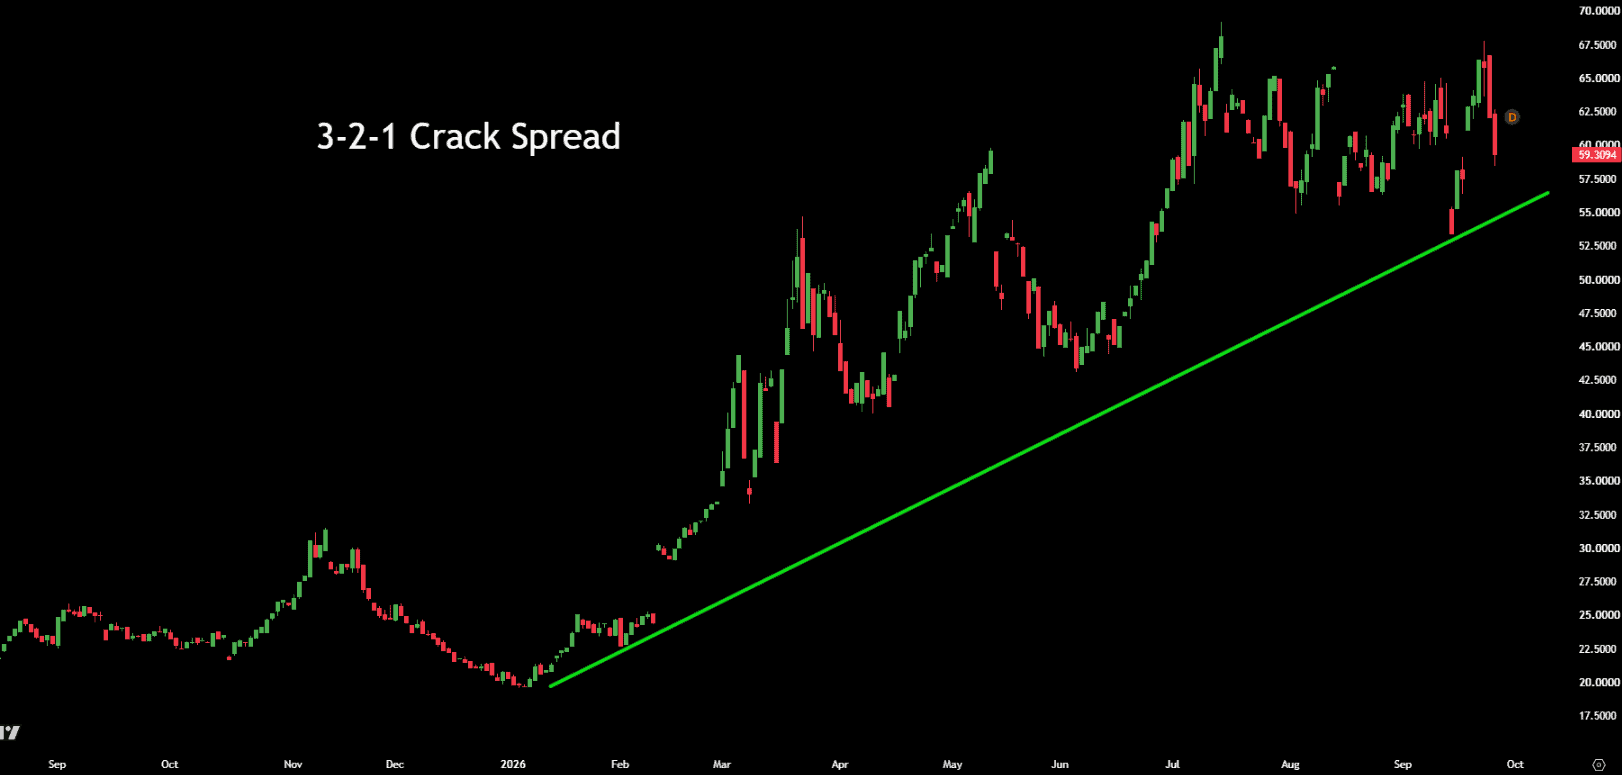
3-2-1 crack spread, weekly. This is the refiner’s profit on each barrel of crude turned into gasoline and diesel. The lower left shows the normal range of $15–20. Today’s margin of about $$60-65 is more than triple that.
What’s a crack spread? Refiners buy crude oil and ‘crack’ it into finished fuels like gasoline and diesel. The crack spread is the difference between what they pay for crude and what they sell the fuel for. In other words, it’s the refiner’s profit margin.
The 3-2-1 example:
- Cost: 3 barrels of crude at about $95 each = $285
- Revenue: 2 barrels of gasoline (about $145 each) + 1 barrel of diesel (about $190) = $480
- Margin: $195 ÷ 3 barrels = about $65 per barrel
- Normal: Typically $15–20. Today’s margin is almost triple that.
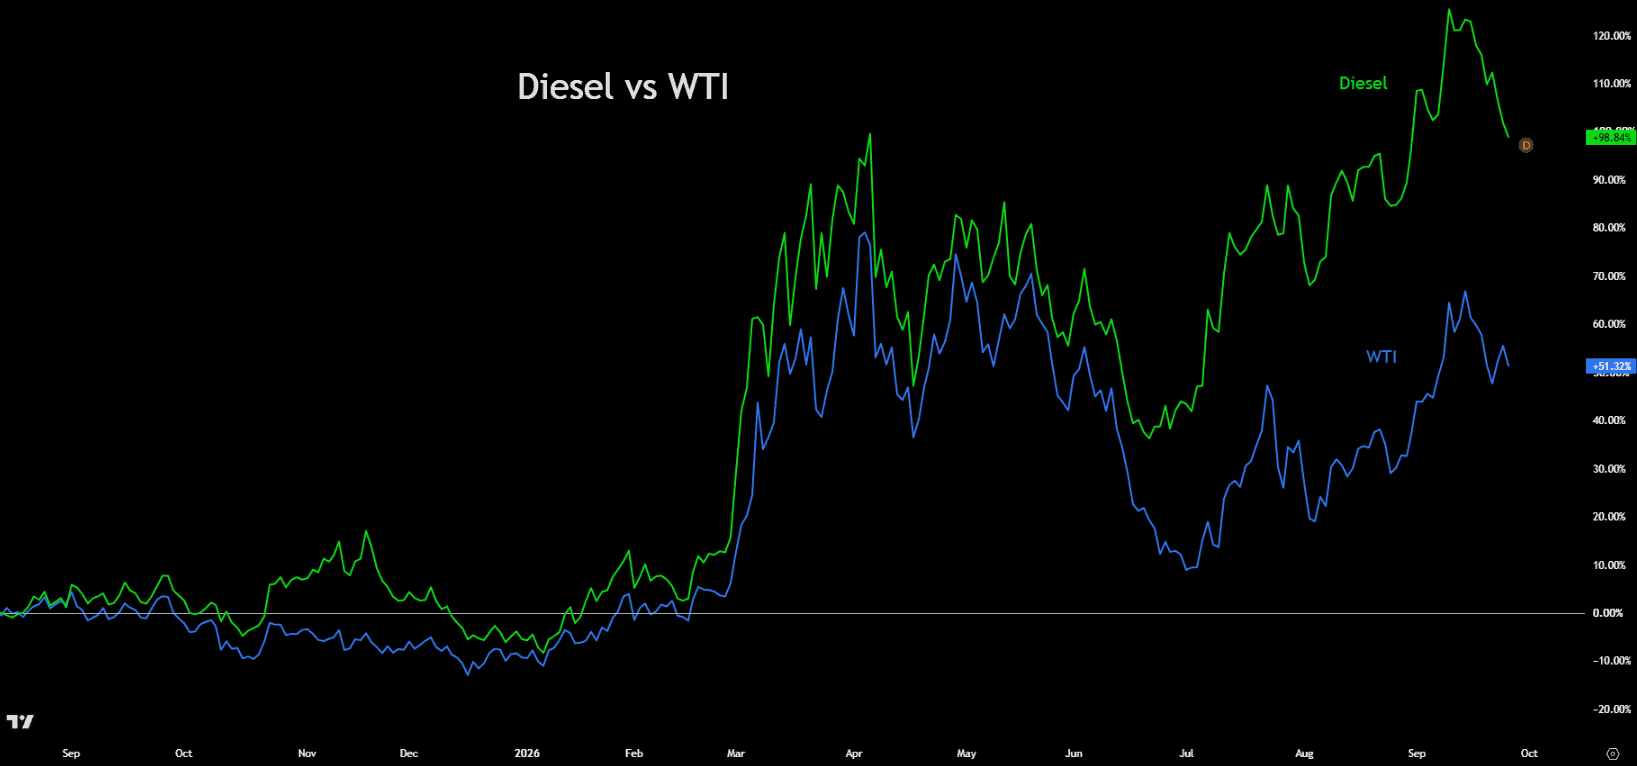
US diesel vs. crude oil. Crude has risen, but diesel has climbed much faster. That widening gap is the refining shortage in action.
This isn’t really a crude oil shortage anymore. It’s a refining shortage, and diesel is where it shows up worst. US diesel recently hit an all-time high.
Why diesel matters to everyone: It isn’t just for trucks. It powers trains, ships, farm equipment and construction machinery, so it touches the cost of almost everything that gets moved or grown.
Why it’s a global squeeze:
- Russia: Ukrainian drone strikes have hit Russian refineries roughly every three days on average this year. Russian refinery output has fallen to its lowest level in over 20 years, and Russia has banned its own gasoline and diesel exports.
- North America: No new US refinery has been built since the mid-1970s. Canada’s last one, in Edmonton in 2017, was its first in 33 years.
- The key difference: A crude shortage can be eased by releasing oil from strategic reserves. A refining shortage can’t. You can’t build a refinery in a week, so diesel prices can stay high even if crude cools off.
3. Why a diesel export ban could backfire (18:30)
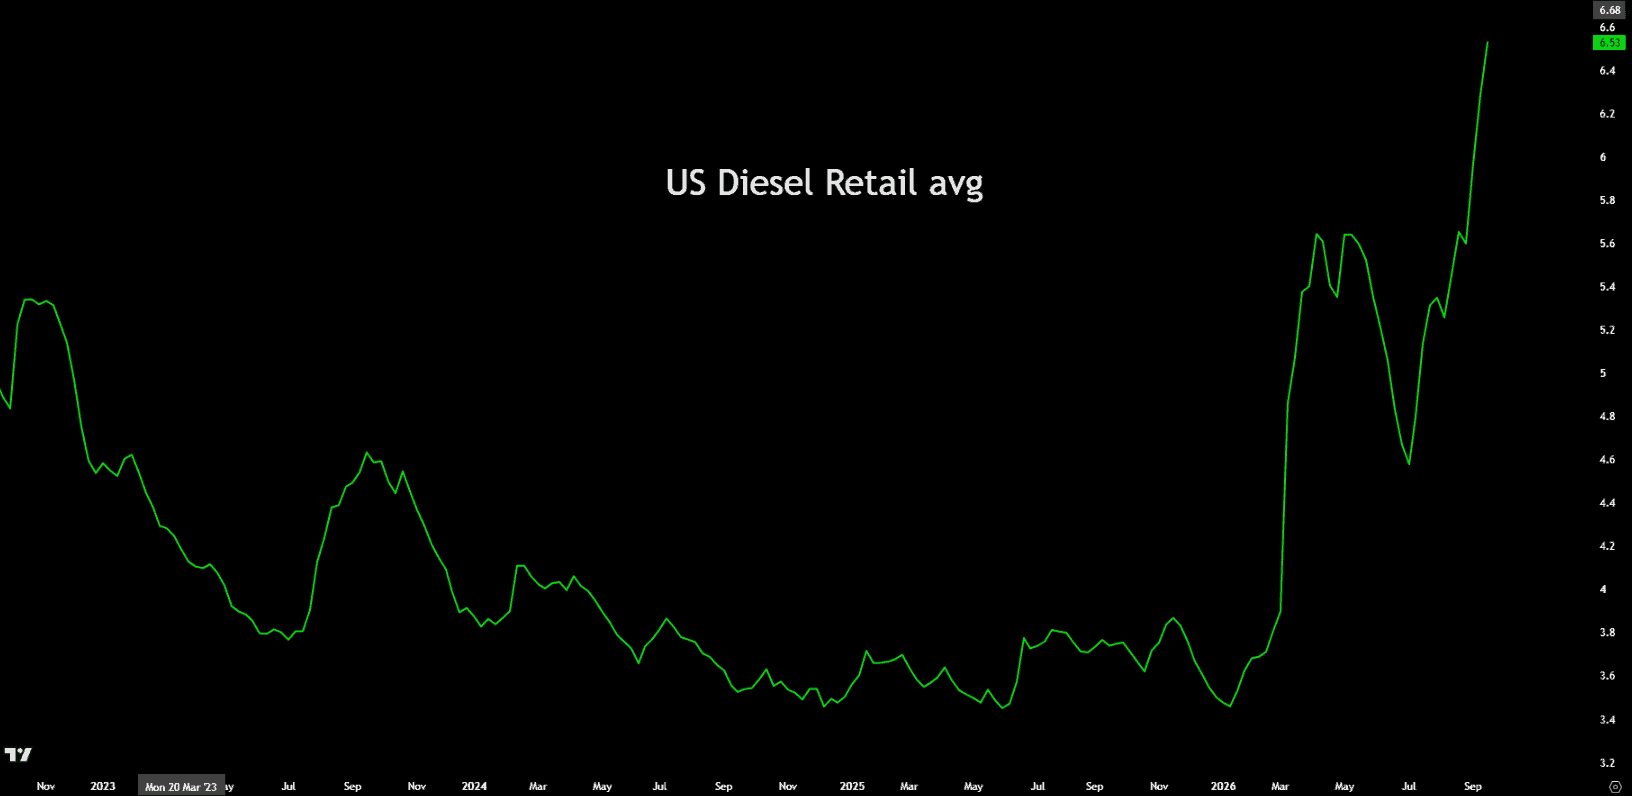
US diesel retail price. Diesel hit a record near $6.50 a gallon, roughly 75–80% higher than a year ago. That’s the pain farmers and truckers are feeling heading into the midterms.
- The idea: President Trump wants to ban diesel exports so more fuel stays home and prices fall. Farmers and truckers are angry heading into the midterms.
- The problem: US refiners are running near full capacity because they can sell surplus diesel overseas at high prices. The US market alone can’t absorb it all.
- What happens next: With exports cut off, refiners would scale back to avoid a glut.
- The backfire: Remember the 3-2-1 example. The same barrel of crude makes gasoline and jet fuel too. Cut refining to reduce diesel, and gasoline and jet fuel supply drop as well, which pushes those prices higher.
- Bottom line: Energy Secretary Chris Wright understands this plumbing. You can’t legislate more fuel into existence by restricting where it goes. You can only decide which fuels get squeezed.
4. Rising interest rates: what they mean for you (21:47)
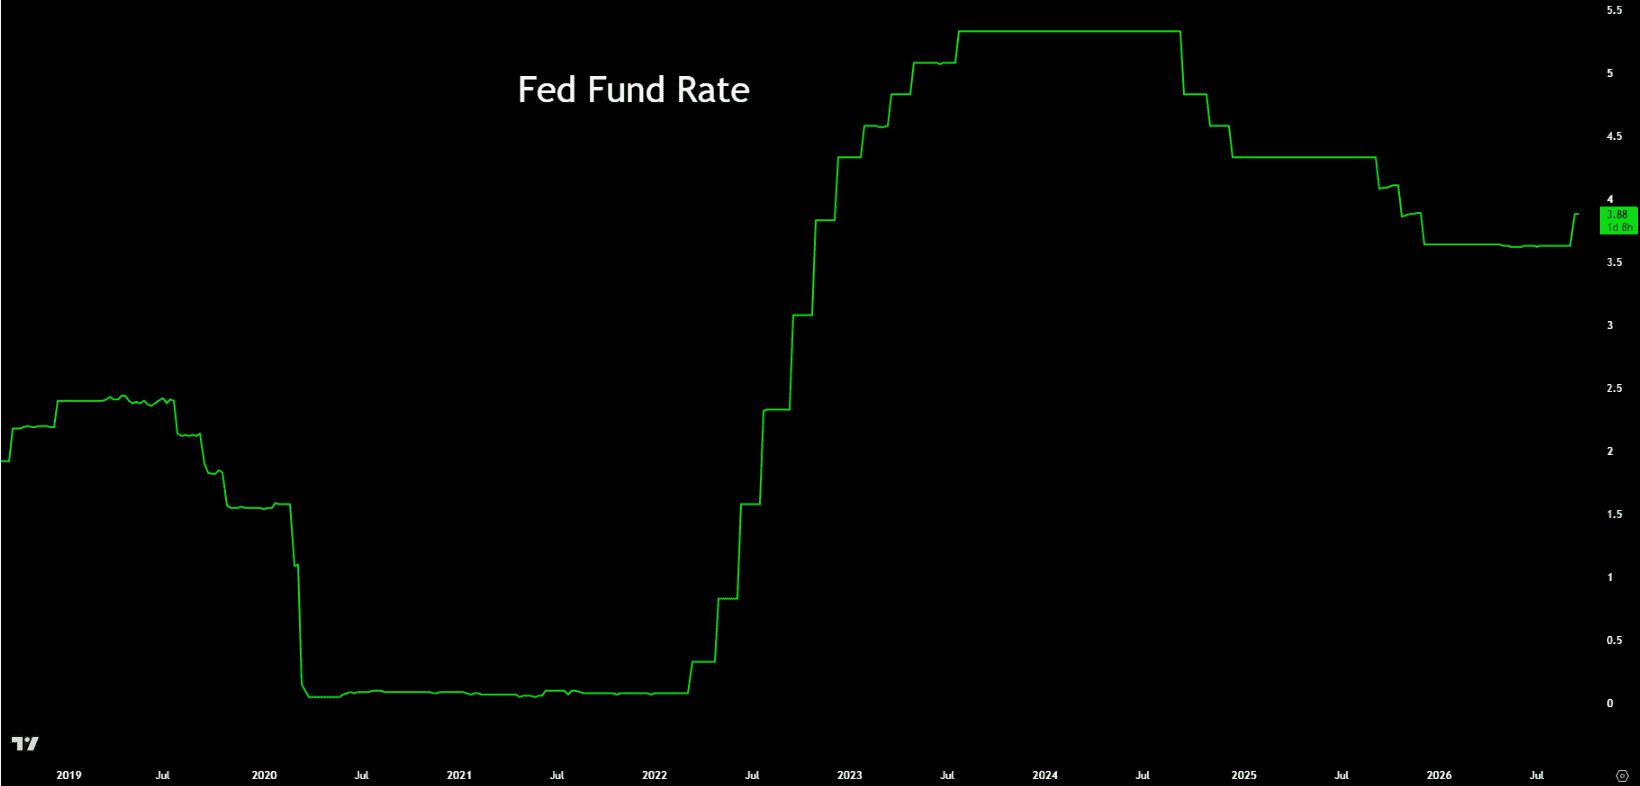
Fed funds rate, since 2019. The Fed cut rates to near zero in 2020, then raised them sharply in 2022–23 to fight inflation. After cutting through 2024 and 2025, it has just raised rates for the first time since July 2023.
Central banks are raising rates because of the energy shock. The Fed just hiked for the first time in three years, and the European Central Bank has hiked twice since the Iran war began. Both cited oil and fuel prices.
- Mortgages: Variable rates and new fixed rates go up. Renewing now likely means a much higher payment than you budgeted for.
- Credit cards and lines of credit: Variable rates rise almost immediately by the same amount as the central bank’s hike, so minimum payments rise too.
- Big purchases: Vehicles, appliances and business equipment all cost more to finance.
- The silver lining: Savers finally earn a bit more on cash in high-interest savings accounts and short-term deposits.
- The real worry: Central banks target about 2% inflation a year. The concern isn’t that inflation exists; it’s that it could surge. When people expect higher prices, they buy early and businesses raise prices pre-emptively. That’s how a temporary energy shock becomes a sticky inflation problem.
5. The bond market warning (25:16)
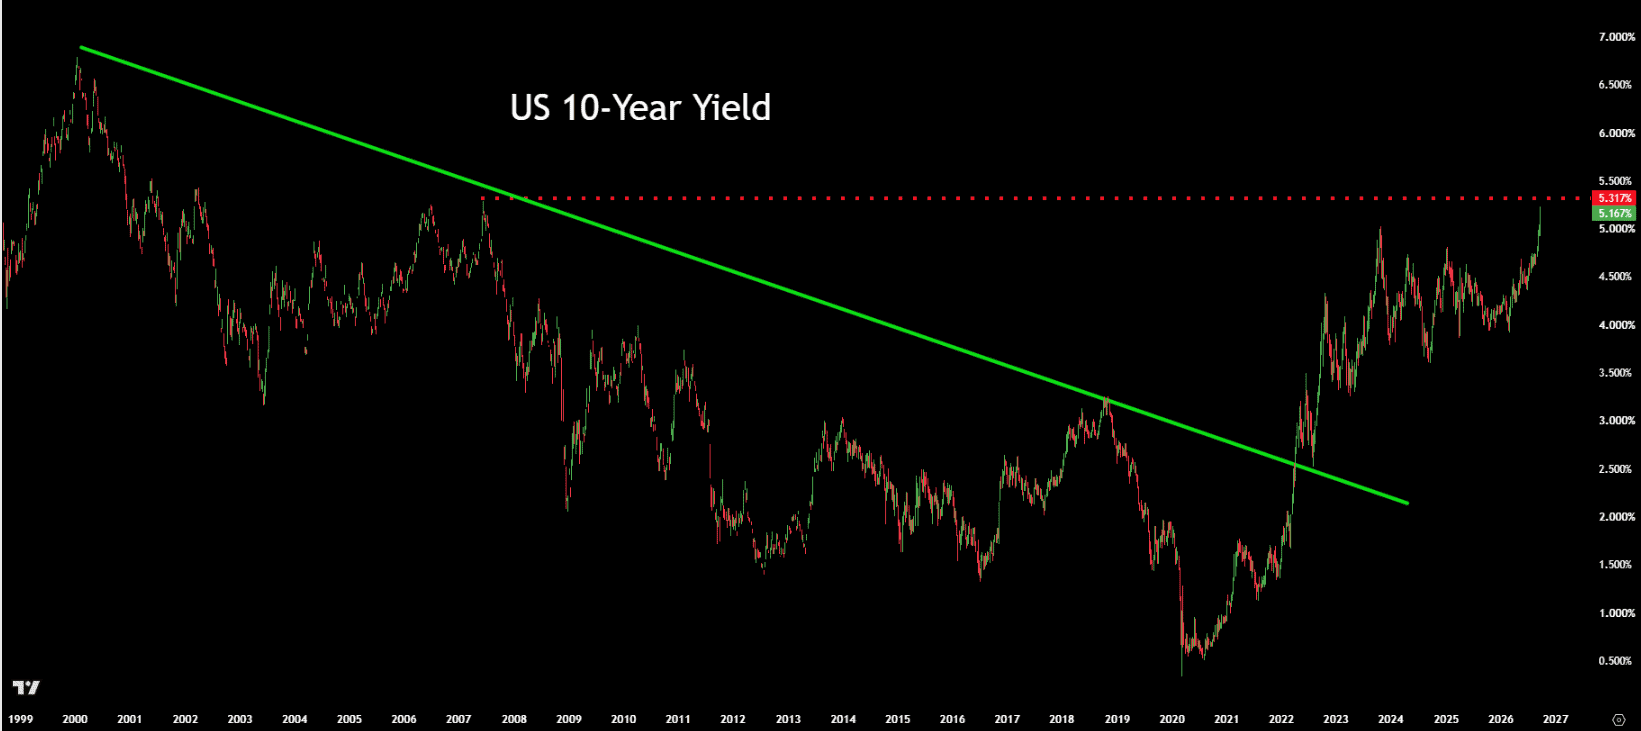
US 10-year Treasury yield, since 1999. For more than 20 years, yields fell steadily (green line), and money got cheaper and cheaper. In 2022 that trend broke, ending the era of cheap money. The yield is now pressing against its 2007 high of about 5.3% (red dotted line), set just before the financial crisis. A break above it would put the 10-year at its highest level in more than two decades.
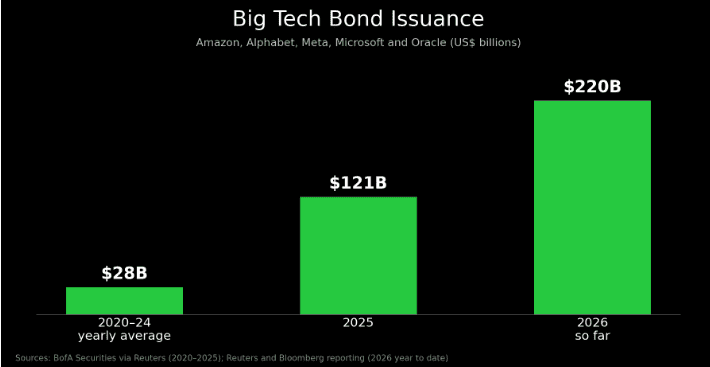
Big Tech bond issuance. The five biggest AI cloud companies borrowed about $28 billion a year from 2020 to 2024. That jumped to $121 billion last year and has already topped $220 billion this year. Source: BofA Securities via Reuters; Reuters and Bloomberg reporting for 2026.
What’s a bond yield? It’s the interest rate investors demand to lend money to a government or company. When yields rise, borrowing gets more expensive for everyone.
- Multi-decade highs: The US 10-year yield hit 5.21%, its highest since 2007, just before the financial crisis. The 30-year is around 5.5%, its highest since 2004.
- Global, not just US: Canada’s 10-year is around 4%, and Japan’s is 3.08%, its highest in about 30 years.
- Three forces at once: Stronger-than-expected economic data, oil back in the $90–100 range, and a Fed chair saying inflation isn’t cooling fast enough.
- A new competitor for lenders: The biggest AI cloud companies (Amazon, Microsoft, Alphabet, Meta and Oracle) used to issue about $25–30 billion a year in bonds. That jumped to $121 billion last year and has passed $220 billion so far this year to fund the AI buildout. They’re also borrowing in euros, yen, Canadian dollars and pounds, so they compete directly with governments for the same pension funds, insurers and bond funds.
- Why stocks care: Higher yields make growth and tech stocks less attractive, because their value depends on profits far in the future.
- The bill coming due: Global debt has topped $365 trillion. The US pays about $1.24 trillion a year in interest on its $40 trillion debt. That reflects an average rate of only about 3.5%, because much of the debt was issued when rates were near zero. If that average climbs toward today’s 5–5.5%, US interest costs could reach $1.7–2 trillion a year, before a single new dollar of borrowing.
- An analogy: It’s like renewing a mortgage at a much higher rate. More of every paycheck goes to interest before anything else gets paid.
6. Currencies: follow the interest rate gap (34:38)
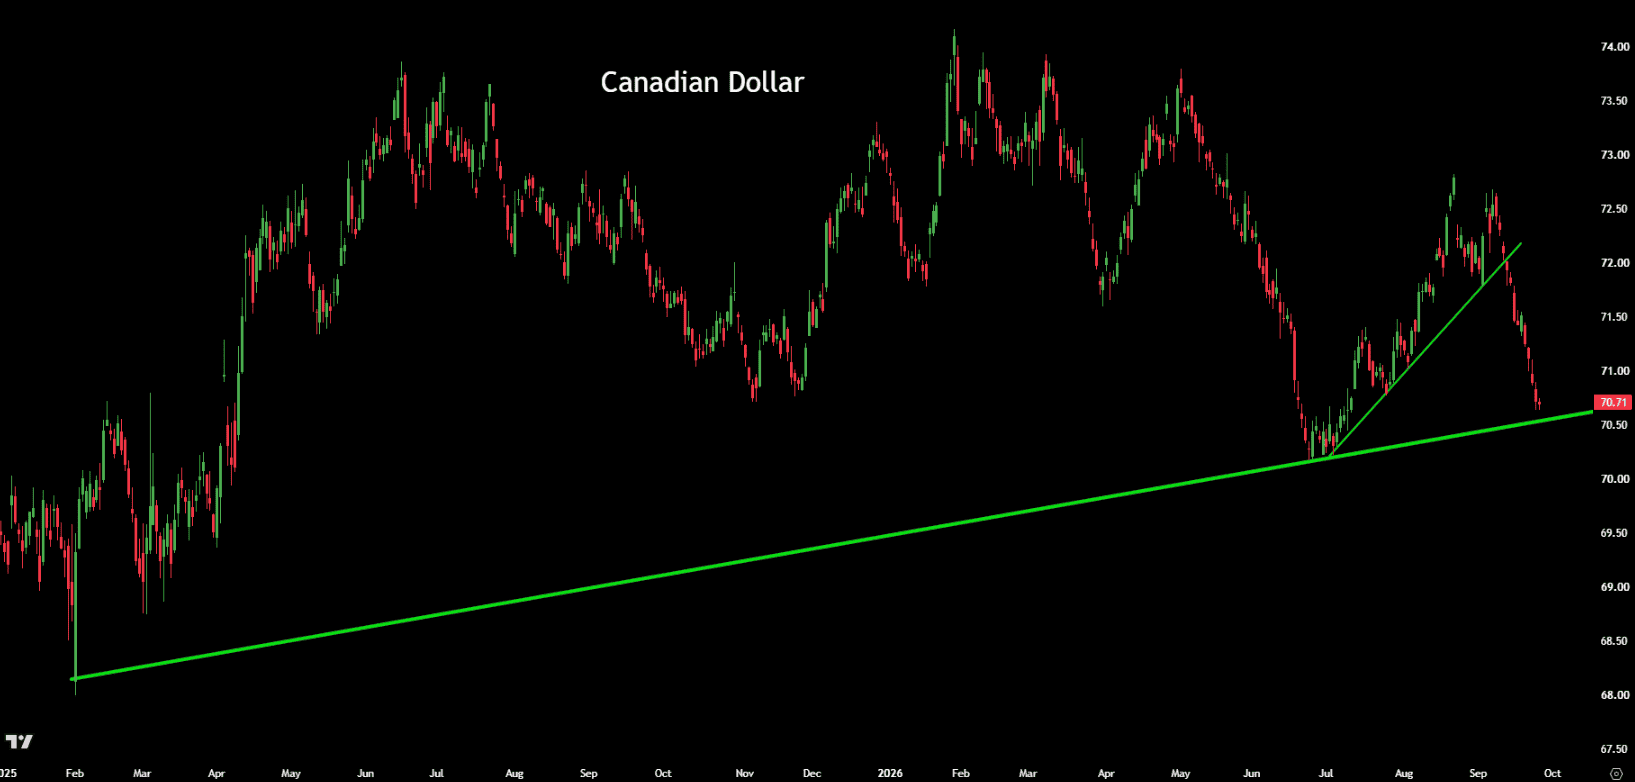
Canadian dollar, in US cents, daily. The loonie broke its short-term uptrend in mid-September (steeper green line) and has since slid from nearly 73 cents to about 70.7. It’s now approaching its long-term support line, which has held since early 2025 and sits around 70.5. If that line holds, the loonie could stabilize. A clean break below it would be a warning sign for further weakness.
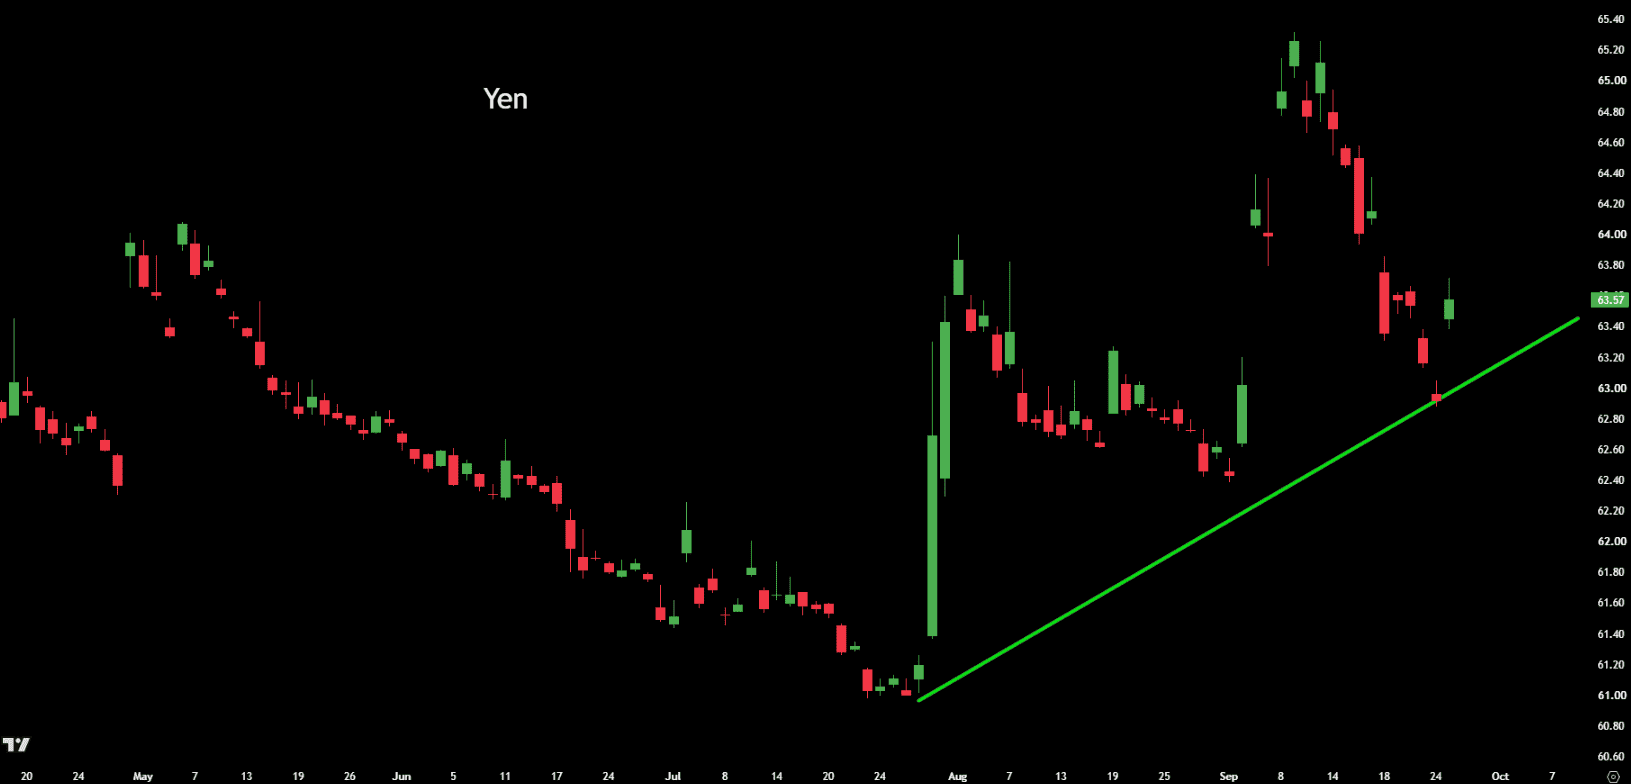
Japanese Yen. A rising line means a stronger yen. After sliding into late July, the yen has climbed in a series of higher lows (green line). It spiked about 5% in early September, gave back more than half of that, and is now bouncing off its rising trendline as talk of government intervention returns. A sharply stronger yen is what could force the carry trade to unwind.
Currencies and interest rates are two sides of the same coin. Money flows to where it earns the most.
- US dollar: The Dollar Index is at 101, its highest since July. Fed officials are openly talking about more hikes.
- Canadian dollar: High oil normally helps the loonie, since energy is Canada’s biggest export. But the Fed is hiking while the Bank of Canada isn’t, so the loonie has slipped from about 73 cents US to just over 70.
- Japanese yen: Japan’s finance minister is voicing concern about yen weakness, and markets are bracing for intervention.
- What’s the yen carry trade? For years, Japan kept rates near zero. Investors borrowed yen cheaply and bought higher-returning assets elsewhere, from US tech stocks to emerging-market bonds.
- Why it matters: As the Bank of Japan raises rates, that trade gets less profitable. If investors unwind it, they sell those assets to buy back yen. We got a preview in August 2024, when a much smaller yen move sparked a sharp global sell-off in stocks and crypto within hours.
7. Gold: the neckline broke. Now what? (38:59)
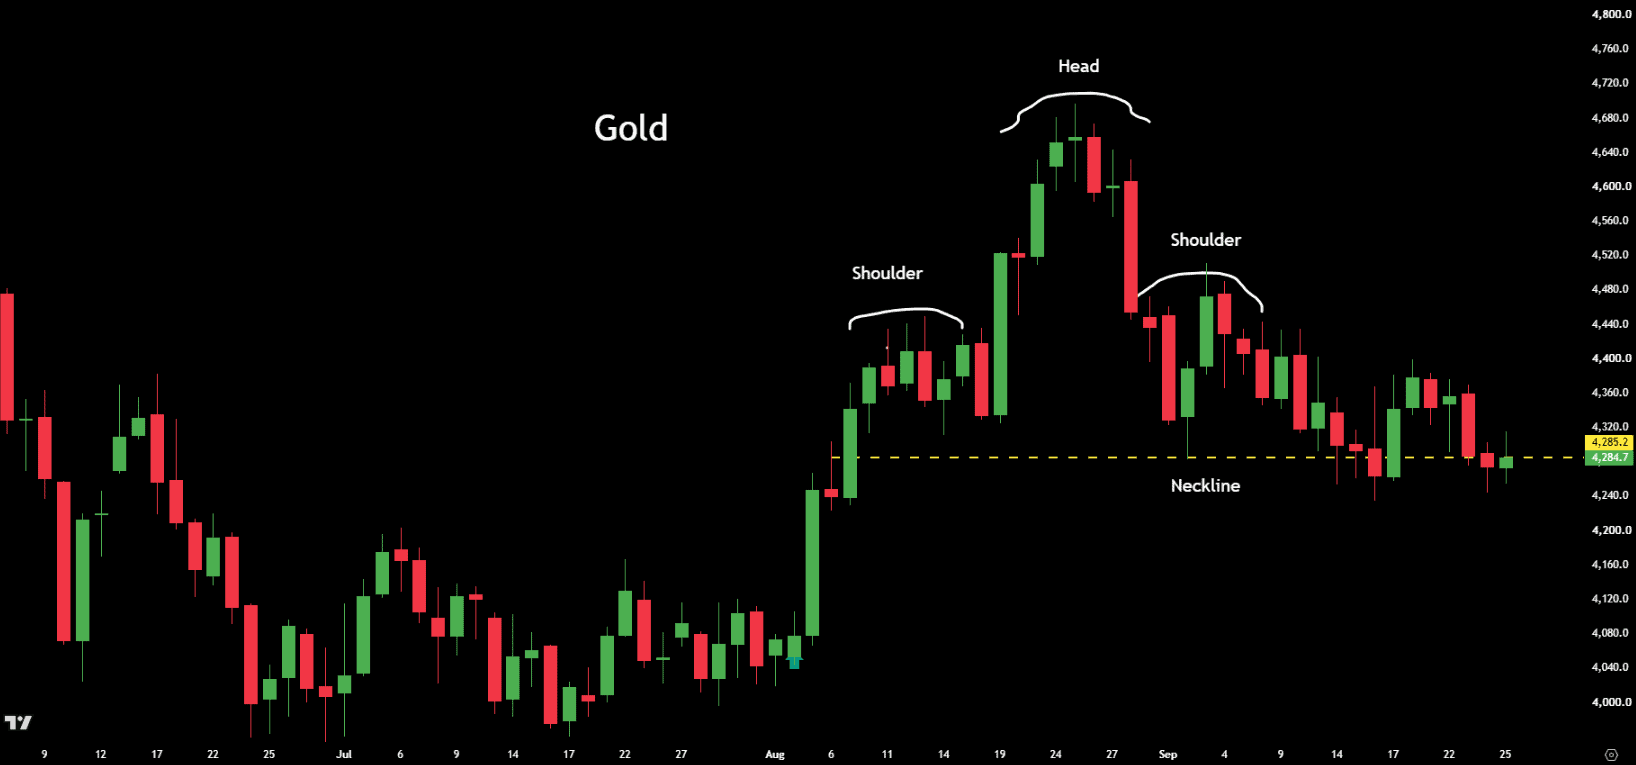
Gold, daily: the head-and-shoulders. Since the January high, gold has formed two lower ‘shoulders’ with a higher ‘head’ on August 25 between them. The line under the shoulders is the ‘neckline’, at about 4,300. Gold closed below it this week, which opens the door to a retest of 3,900–4,000.
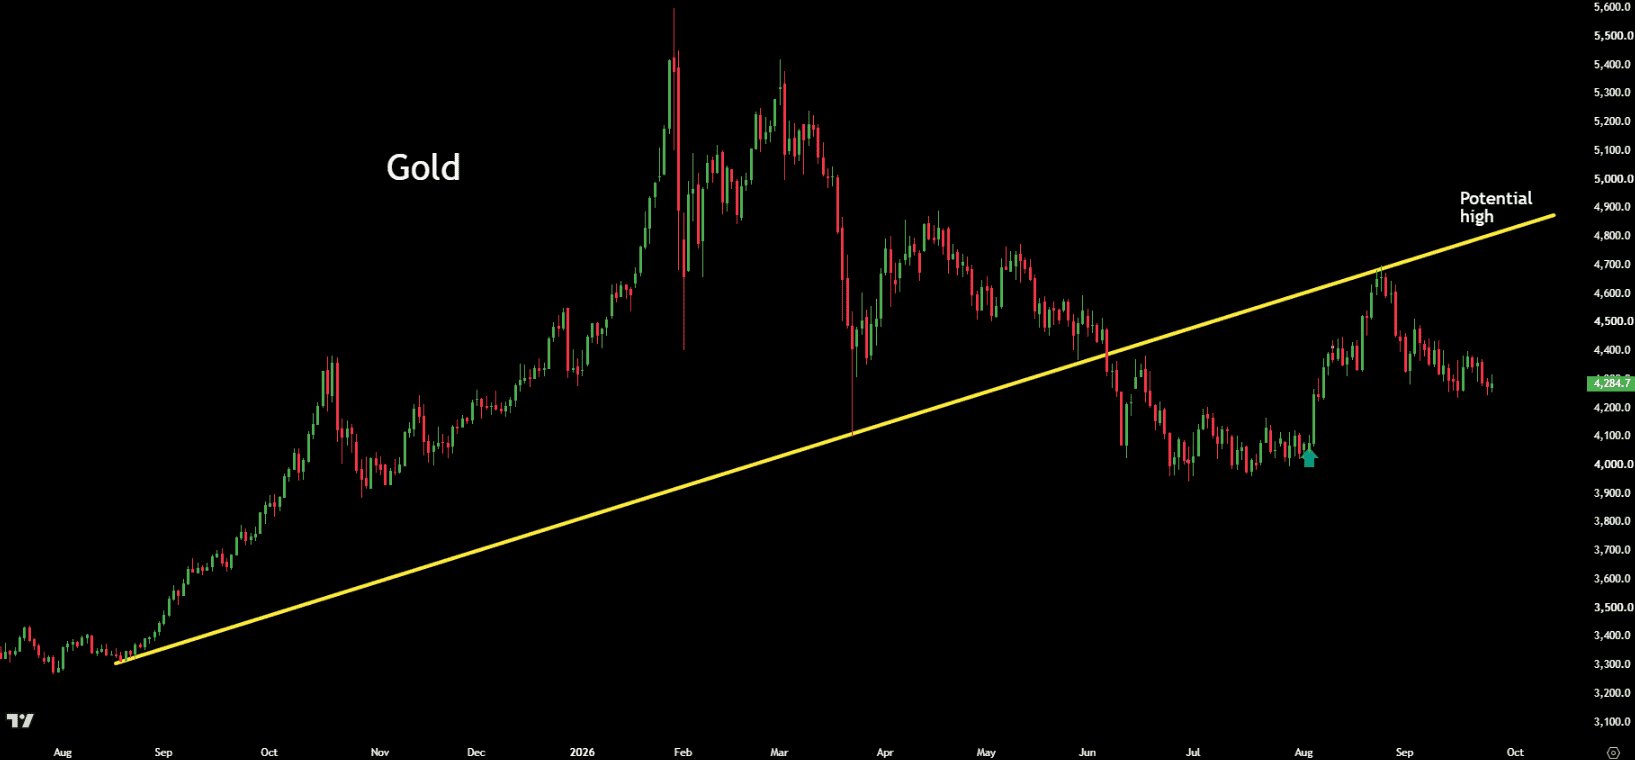
Gold, daily: the rising trendline. This line runs from the start of gold’s big run, through the March 23 low, to the August 25 high. It’s acting as resistance. Because it slopes upward, it leaves room for a run toward 4,700–4,800 by mid-October.
What’s a head-and-shoulders pattern? It’s three peaks, with the middle one (the ‘head’) highest and the two on either side (the ‘shoulders’) lower. A line under the shoulders is called the ‘neckline’. A close below it is a bearish signal.
- What happened: Gold broke below the roughly 4,300 neckline earlier this week and is trading just under 4,290.
- Why it’s struggling: The Fed’s hawkish rate hike. Gold pays no interest, so higher rates make interest-paying assets look more attractive.
- Why it’s holding up well: Given how fast yields are rising, gold has barely reacted to the hike.
- The bullish case: The rising trendline shown in the second chart is acting as resistance. Because it slopes upward, it leaves room for a run toward 4,700–4,800 by mid-October.
- The big picture: Governments are running enormous deficits. On top of its $40 trillion debt, the US has over $200 trillion in unfunded liabilities such as Social Security and Medicare. Governments can print currency, but they can’t print gold.
- My view: Any pullback in gold is a buying opportunity. We’ll flag specific entry points to Trend Letter subscribers.
8. Stocks: making money now vs. promising it later (43:52)
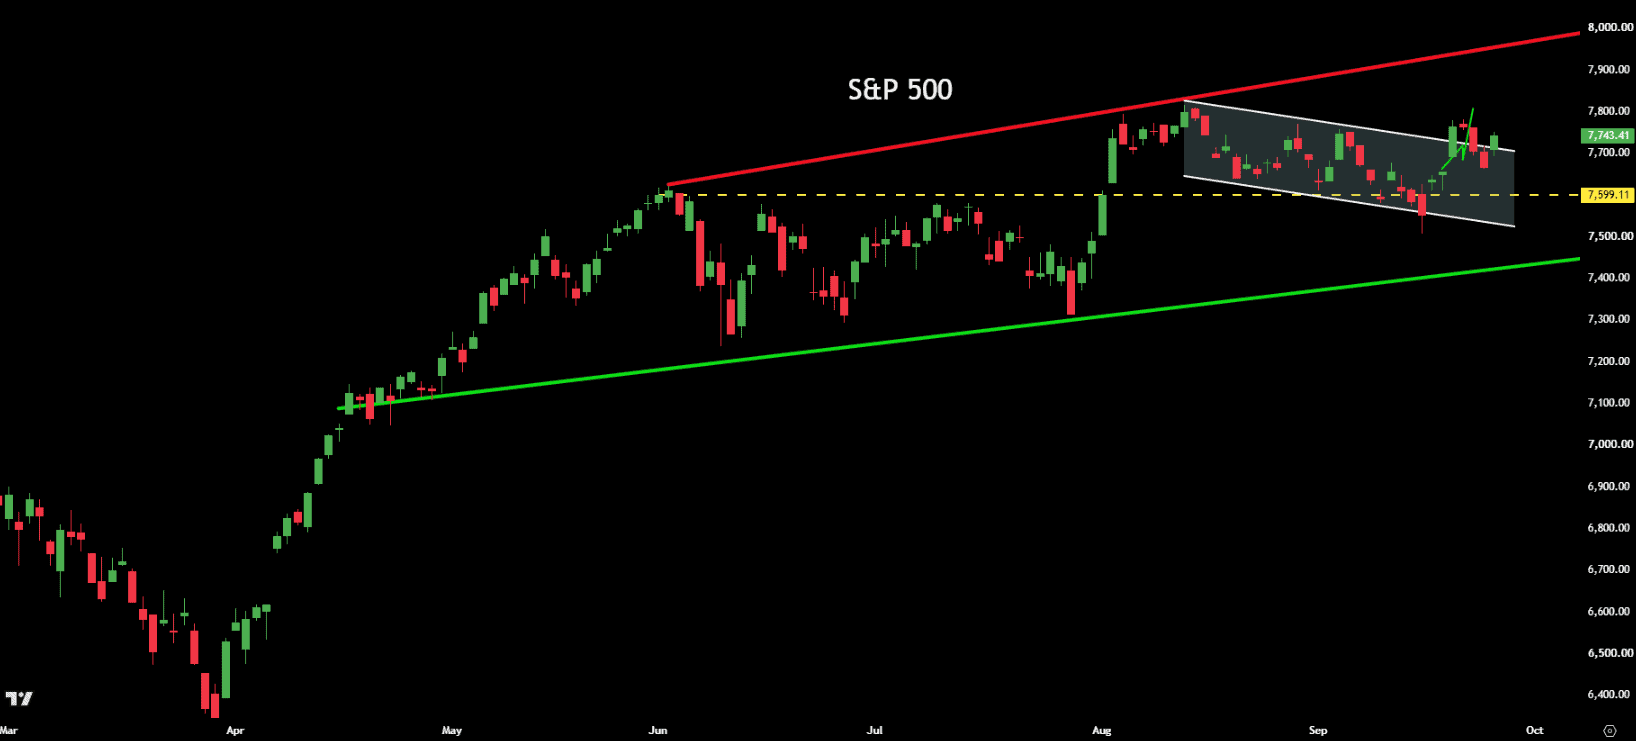
S&P 500, daily. The index has climbed in a rising channel since April (green line = support, red line = resistance, now near 8,000). Since mid-August it has paused in a ‘bull flag’ (shaded area): a short, gentle drift lower after a big run that often comes before the uptrend resumes. It dipped briefly below 7,600 in mid-September, then pushed back up and out of the top of the flag. The yellow line at 7,600, June’s breakout level, is the key support to watch.
- The dividing line: It’s less about which sector you’re in, and more about whether a business is making money now or is priced on a story about the future.
- Holding up: Chipmakers and memory makers riding a real shortage (Micron is up over 260% this year), and energy stocks, especially refiners, riding real oil prices.
- Getting squeezed: Companies priced on distant future growth, as yields rise.
- Levels to watch: The S&P 500 is around 7,740. It has been climbing in a rising channel since April and chopping between 7,600 and 7,800 for several weeks.
- Key support: 7,600, the old June breakout level. As long as it holds on a closing basis, the uptrend is intact. A clean break below it would be the first real warning sign.
- Expect volatility: Valuations are stretched, September is historically the S&P’s worst month, and markets dislike the uncertainty of the midterms.
9. DeFi: Wall Street moves onto the blockchain (48:36)
- What’s DeFi? Decentralized finance: financial services run on a blockchain instead of through traditional banks and exchanges.
- What’s tokenization? Creating a digital version of a real-world asset (a stock, bond, building or piece of art) that lives on a blockchain, so it can move faster and settle instantly.
- NYSE and Blockchain.com: A new agreement lets Blockchain.com users buy tokenized US stocks and ETFs through the NYSE’s digital platform, without first converting their crypto into dollars.
- Ondo Finance and BlackRock: Ondo is launching ‘intelligent portfolios’, professionally built portfolios packaged as a single token and based on strategies BlackRock developed for on-chain use.
- Why it matters: The biggest names on Wall Street (BlackRock, Goldman Sachs, JPMorgan, BNY Mellon and Franklin Templeton) are now all talking tokenization. This is big.
DeFi Digest is still free, but not for long.
To get on the Defi Digest list, email us at info@thetrendletter.com and ask to be put on the list. A new issue is coming in the next week or two.
Special offer for This Week in Money listeners
- Any one service: $250 off
- Any two services: $600 off
- All three (Trend Letter, Trend Technical Trader and Trend Disruptors): $1,050 off
Martin