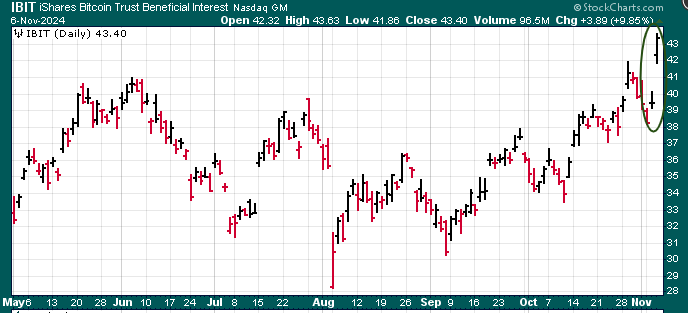
Bitcoin Breaks $100K: What’s Next?
We’ve received a flood of questions about Bitcoin this past week after it shattered the psychological $100K barrier. As most investors are aware, Bitcoin’s rally gained momentum following Donald Trump’s vocal support for cryptocurrency earlier this year.
Back in July, Trump addressed the Bitcoin 2024 Conference in Nashville, unveiling plans to establish a strategic national Bitcoin reserve and a crypto advisory council. Post his November election victory, Trump doubled down on his crypto advocacy by appointing pro-crypto individuals to key positions and committing to making the U.S. the “crypto capital of the planet.” He even proposed creating a Bitcoin Strategic Reserve Fund.
During this period, Bitcoin surged approximately 60%, culminating in its historic break above $100K. Now, the question everyone is asking is: What’s next?
The Fundamentals Behind Bitcoin’s Rise
While we focus on technical analysis, it’s crucial to understand the underlying fundamentals driving Bitcoin’s ascent:
- Decentralization:
Bitcoin operates independently of central authorities, appealing to those who value financial autonomy and seek protection from government overreach. - Limited Supply:
With a maximum supply of 21 million coins, Bitcoin’s scarcity contrasts with inflation-prone fiat currencies, making it an attractive store of value. - Digital Gold Narrative:
Bitcoin is often compared to gold as a hedge against inflation, extreme government debt, and economic uncertainty, appealing to risk-conscious investors. - Security and Transparency:
Blockchain technology ensures transactions are immutable and verifiable, reducing fraud and enhancing trust. - Global Accessibility:
Bitcoin empowers people worldwide by enabling financial transactions without reliance on traditional banking systems, especially in unstable economies. - Privacy and Control:
Bitcoin offers users more privacy and control compared to traditional payment systems, bypassing intermediaries like banks.
The Technical Perspective
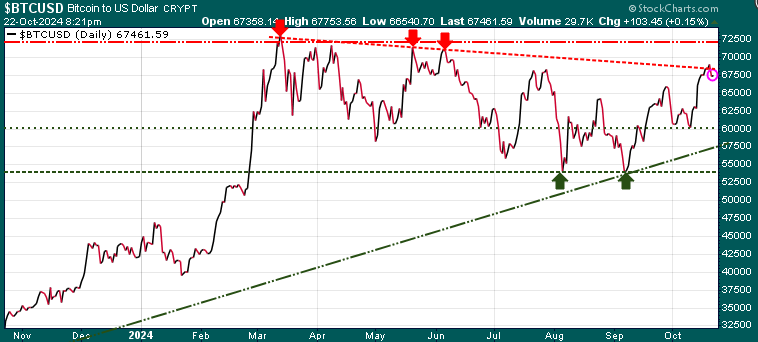
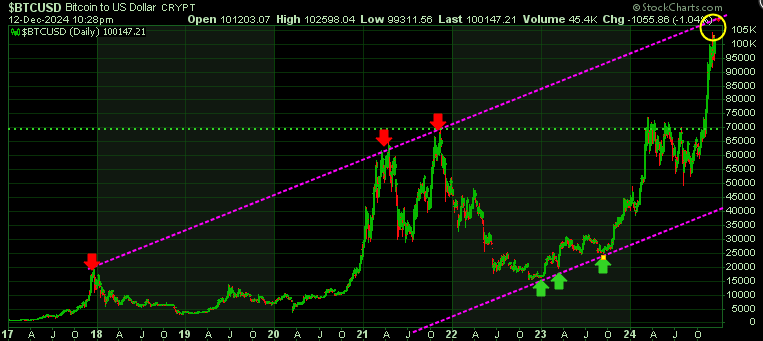
From a technical standpoint, Bitcoin remains within an upward channel. Here are the key levels to watch:
- Upper Range: $108K
- Lower Range: $97.5K
Potential Breakouts:
- A break above $108K could set Bitcoin on a path toward its next target of $200K.
- A break below $97.5K might trigger a significant correction, potentially testing near-term support at $86K
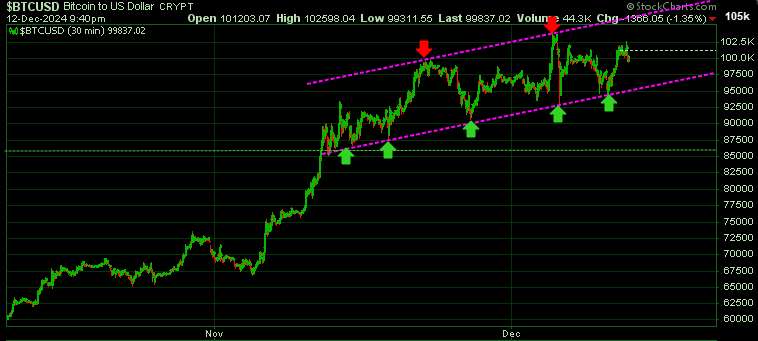
Looking at the longer-term charts, Bitcoin appears to be nearing the upper range of its trend channel, hinting at a possible pullback soon. If Bitcoin drops below $86K, a deeper retracement toward the $70K region could be on the horizon.
Conclusion
While opinions are exciting, the charts will ultimately guide us. Bitcoin’s next move, whether upward or downward, will likely be dramatic given its history of volatility.
Stay tuned!