
From Friday, March 13/20
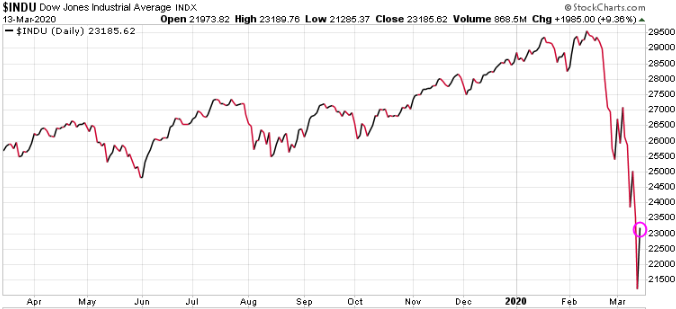
DJIA lost “only” 2686 points this week, after dropping as much as 4709 points into Thursday’s close.
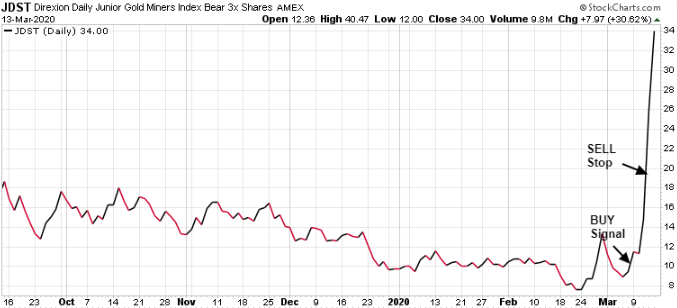
JDST (Junior Gold 3 x Leveraged Bear) was closed at Thursday’s open of $19.20, an 86% gain in less than a week.
It then went on to gain another 100% at today’s high, or 292% above our entry the week previous.
Incredible!
There’s been major liquidation in gold and silver as a result of Thursday’s historic market drop, especially in related stocks, to meet a massive amount of margin calls.
We’ve repeatedly warned that it is not a given that precious metals are a “safety asset” in times of trouble. Sometimes, such as this time, it’s quite the opposite.
Wednesday we wrote: “We wouldn’t be surprised to see JDST trade far higher in due time, but wish to avoid a major dip if we can instead book the gains on offer and step aside for now, and perhaps re-enter it at a much lower price.”
This morning JDST plunged to open 52% below Thursday’s close (36% below our sell Thursday morning), then rallied 227% from today’s open (from $12.36 to $40.47) before dropping 16% in the last 15 minutes of trading. It’s down a further 25% after the close, which is down 33% from the day’s high hit just 15 minutes before the close of trading.
While we certainly wish we’d held on longer or set a much higher offer price at which to sell our JDST position, what happened at the open this morning, and the unprecedented action during the day, assures us we did the right thing in selling when we did. That action could just as easily have gone against us.
Due to the liquidation in gold, today’s being the largest single-day sell-off in seven years, we probably have a sell signal in our GTI (Gold Trend Indicator) however we won’t calculate it yet and will instead post it on Monday.
Our GTI algorithm is designed to beat normal markets, even mania markets, and it has done so admirably for many years. It signaled extremely bullish in late 2015 and again in late 2016 when the world was ultra-bearish on gold for example, however it is not, and cannot be, designed to account for virtually unprecedented extremities such as the action of the past week.
Luckily we went into the week with JDST as a hedge, and thanks to great gains already this year in several gold-related positions we don’t feel it’s warranted to join the panic by selling DGP, much less to short gold at this point.
This liquidation provides us a tremendous opportunity going forward however, and if gold does continue to slide and take DGP lower with it, we’ll more than make up for it on the next bullish signal or when the chance to short looks like a better setup.
Our basket of suggested mining penny stocks is on average flat since we suggested them in late December, which is remarkable given what’s happened to most stocks in the sector since then. We believe those to be at reasonable entry levels to hold as long-term speculations, with the original caveats still applicable of course.
No change in our outlook or sentiment.
For the Dow Jones Industrial Average we have a new, lower Weekly pivot now at 27105.
Until markets settle however, we suggest ignoring this Indicator too as it is also not, and cannot be, designed for such unusual chaotic conditions. Luckily our Indicators had us very bearish and short the market in recent weeks, and if the DJIA gets above 27100 it’d be a better time to add short positions or sell existing holdings rather than go long, we believe, as stated earlier in the week.
We reiterate that recent market action, including today, while extreme is at the same time normal within context of a bear market beginning its long descent.
We still expect to renew short positions between DJIA 26000 – 28000.
While others were selling in panic or being stopped out of positions the past week, we were covering short positions for massive profits then buying on what turned out to be one of the worst market days in history.
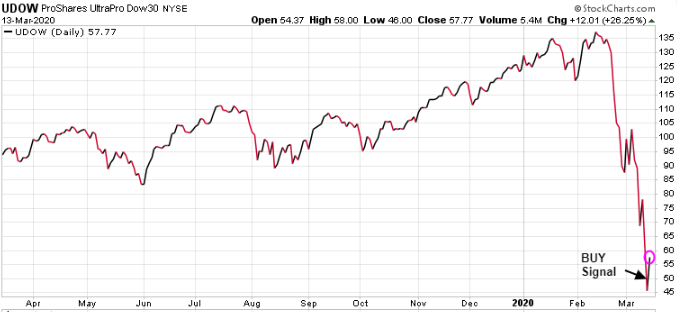
UDOW (3 x leveraged Long Dow ETF) was entered at the open Thursday of $51.93 and we regard it as still open since it had not fallen below our suggested sell stop “20% below our actual entry price“.
It closed today 11.5% higher, and we’ll raise the stop on UDOW to $45.40 which is just below its low on Thursday.
Do not chase this one as its a 3x levered speculation on the DJIA rising, and the DJIA already gained 2000 points today.
Until further notice, if UDOW hits $76 sell it.
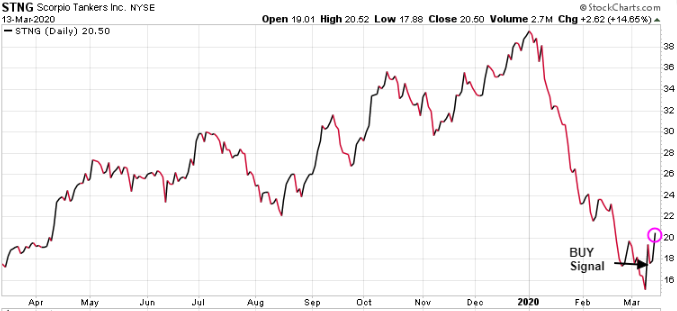
All of our suggested entries from Wednesday’s Update were triggered, most notably STNG already up 15% from our entry.
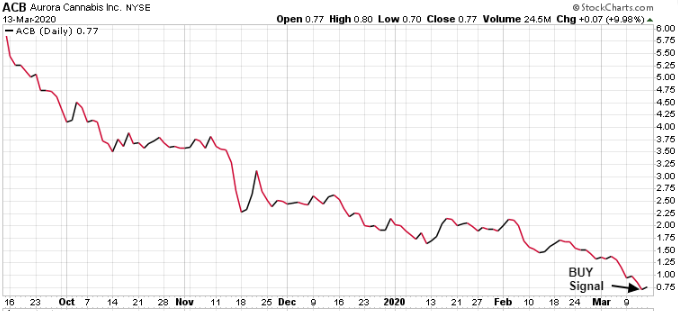
ACB +13%.
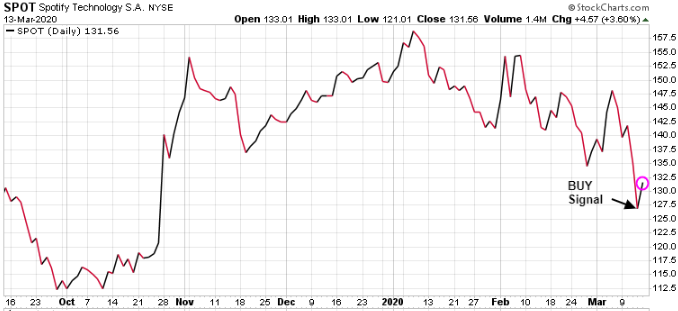
and SPOT +5%.
We may book significant short-term gains on these if markets continue to rally next week, which we expect will be the case. More about that on Monday.
Unsurprisingly, one of the most notable market routs in history knocked down the share price of some of our existing holdings. As stated when we removed the stops, expecting exactly this might happen, we’re OK with holding those in the long term and perhaps adding to them at lower prices, particularly FNMA for now and perhaps others once markets settle. Pick some up FNMA for the long term if you haven’t already done so.
Open Positions
Omitted in free sample.
Indicators
GTI (Gold Trend Indicator) : Bullish
Dow Jones Industrial Average:
Weekly: bearish, 27105 Moderately aggressive investors, trading or hedging on an intermediate basis, who follow the Weekly Indicator may find it prudent to be hedged or net short if the DJIA is trading below this pivot level. Reminder – we do not have a change to “bullish” or “bearish” unless the DJIA closes the calendar week above/below this pivot level.
Monthly: bearish, 29570 Conservative investors, trading or hedging on a longer-term basis, who follow the Monthly Indicator may find it prudent to be hedged or net short when the DJIA is trading below this pivot level. Reminder – we do not have a change to “bullish” or “bearish” unless the DJIA closes the calendar month above/below this pivot level.
NOTE : Speculators and frequent traders will prefer to use the Daily or Weekly Indicator as trading or hedging pivot points, while longer-term investors may prefer to consider only the Monthly Indicator.
Gold & Silver Penny Stock Basket
A basket of tickers trading in Canada on the Vancouver Venture Exchange, suggested on December 27 2019, that we find particularly compelling and have relatively low floats (number of shares outstanding) which should magnify potential gains if speculative capital flows into this sector.
Until that may happen we consider these like lottery tickets or call options that won’t expire, so will not employ stops and as a result suggest only small amounts of highly speculative capital is appropriate for such positions. For example, consider spreading the amount normally put into a single position like JNUG into all of these in equal portions:
Omitted in free sample.
From Wednesday, March 11/20
To know what to expect from the future, we must study the past. In the past, TTT has an exemplary record of calls on the long side, if and when stocks are actually reasonably priced, or better yet under-priced, and it won’t be different this time.
Going into 2020 everyone was talking about a coming market “melt-up”, while we were adamant that a melt-down was fast approaching. Way back in early 2016 however, we wrote the following:
“The start of 2016 has been the worst start to a calendar year in all of stock market history, more than validating our bearish outlook.”
Sounds just like today, doesn’t it? We continued:
“Should the senior index close above 18000, there’d be high odds of a “melt-up”.”
We were predicting a melt-up four years before it became fashionable to do so. Here’s a 5-year chart of the DJIA for context:
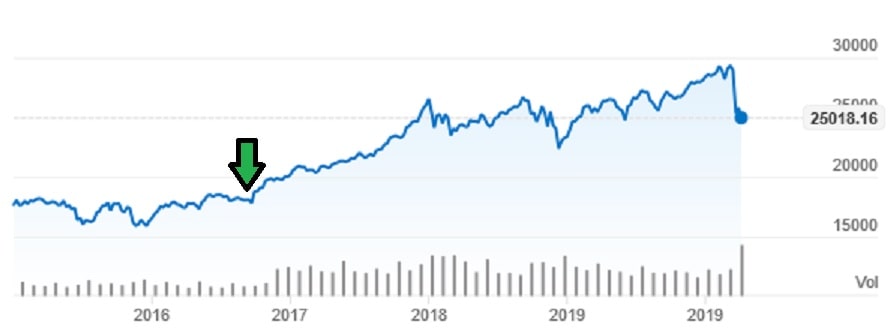
The green arrow shows when we turned bullish, later in 2016, and indeed a massive melt-up began once the DJIA crossed above 18000 just as we’d predicted.
And as can be seen from what happened starting early in 2018, we were as right to turn bearish then just as we were right to remain so the past two years up to the present.
What else was going on in early 2016? Oil crashed into the high $20 range. Sounds familiar? Have a look:
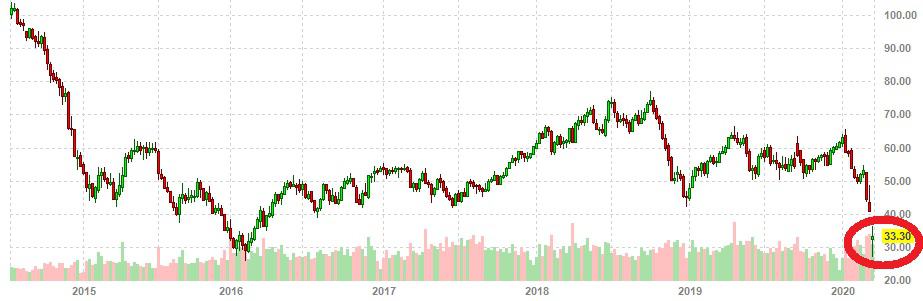
As you might expect, the world was totally bearish on oil.
What did we do? Bought a bunch of oil stocks. We made an absolute killing on those positions, while booking huge dividends.
We’ve been saying for longer than we can remember that when a stock market crash was again front-page news, and all the raging bulls had been punished into frightened submission or turned bearish, we’d be buying in bulk.
It’s time to go shopping!
The usual caveats apply. Don’t chase prices, and always adhere to stops & limits, whether ours or your own.
Our trade suggestions are examples. Each individual must consider what’s best for their own unique situation, risk tolerance, and portfolio(s), ideally after also consulting with a trusted advisor or reputable, competent broker. With readers across the globe, we typically only suggest positions in North American stock exchanges, usually in the U.S., which anyone around the world can trade easily via a typical online account.
Some of the ideas do not have direct equivalents on the exchanges of other countries. Searching online for a similar instrument, be it for hedging against falling markets or shorting junior gold miners as a group, may yield suitable substitutes trading on your national exchange or in your preferred currency, or again consulting with your financial advisor or broker should be of help.
If this Free Sample has piqued your interest and you wish to implement prudent hedging strategies to protect your financial position in the event of severe market declines, we are extending the World Outlook Financial Conference prices to anyone who subscribes this weekend. We will never offer better prices than these to new subscribers.