Our mission as an investment newsletter is to research and provide the best information for our subscribers, assisting them to become better, more successful investors.
Navigating through the current market environment continues to be challenging, and we don’t anticipate it getting easier in the very near-term. The unique dynamics of this year have made it a year of adaptation, having to be constantly mindful of fluctuating market uncertainties. which can be a source of stress for investors.
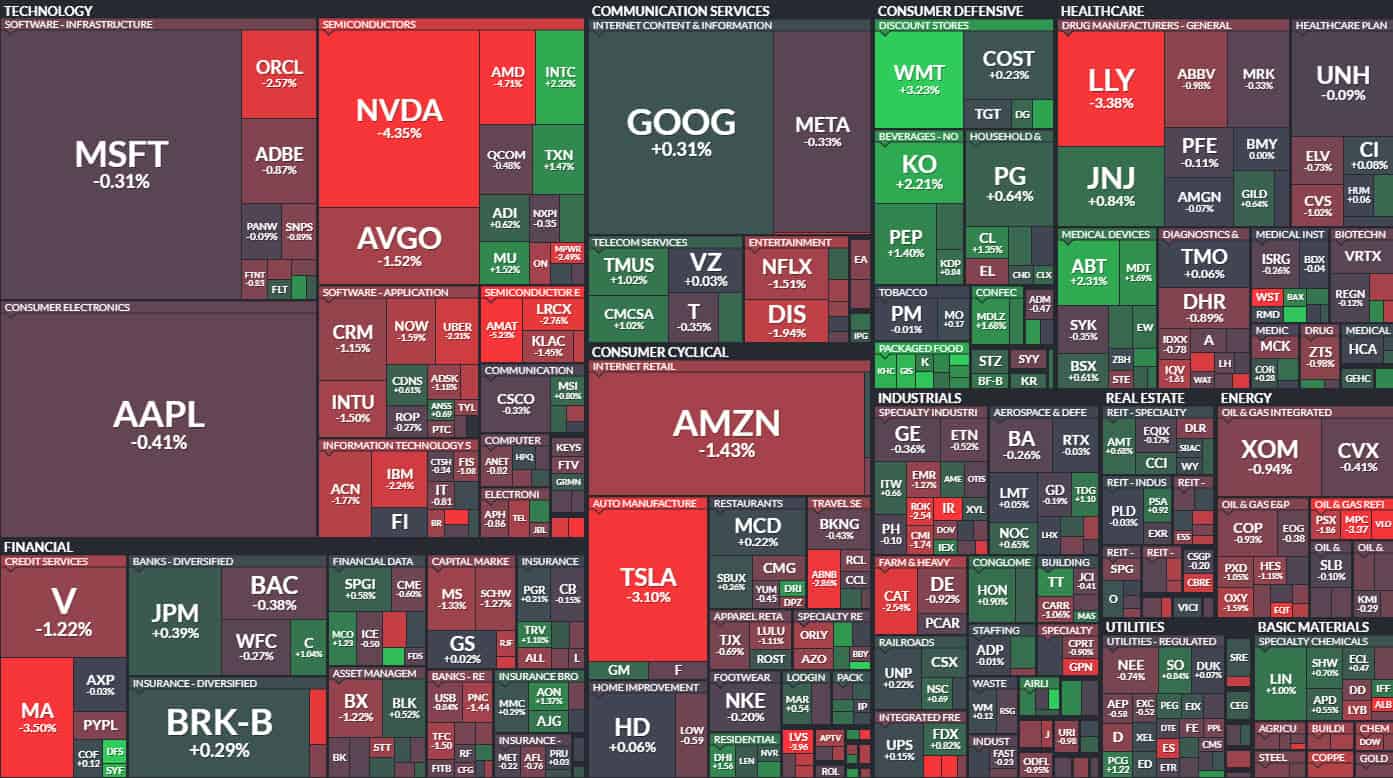
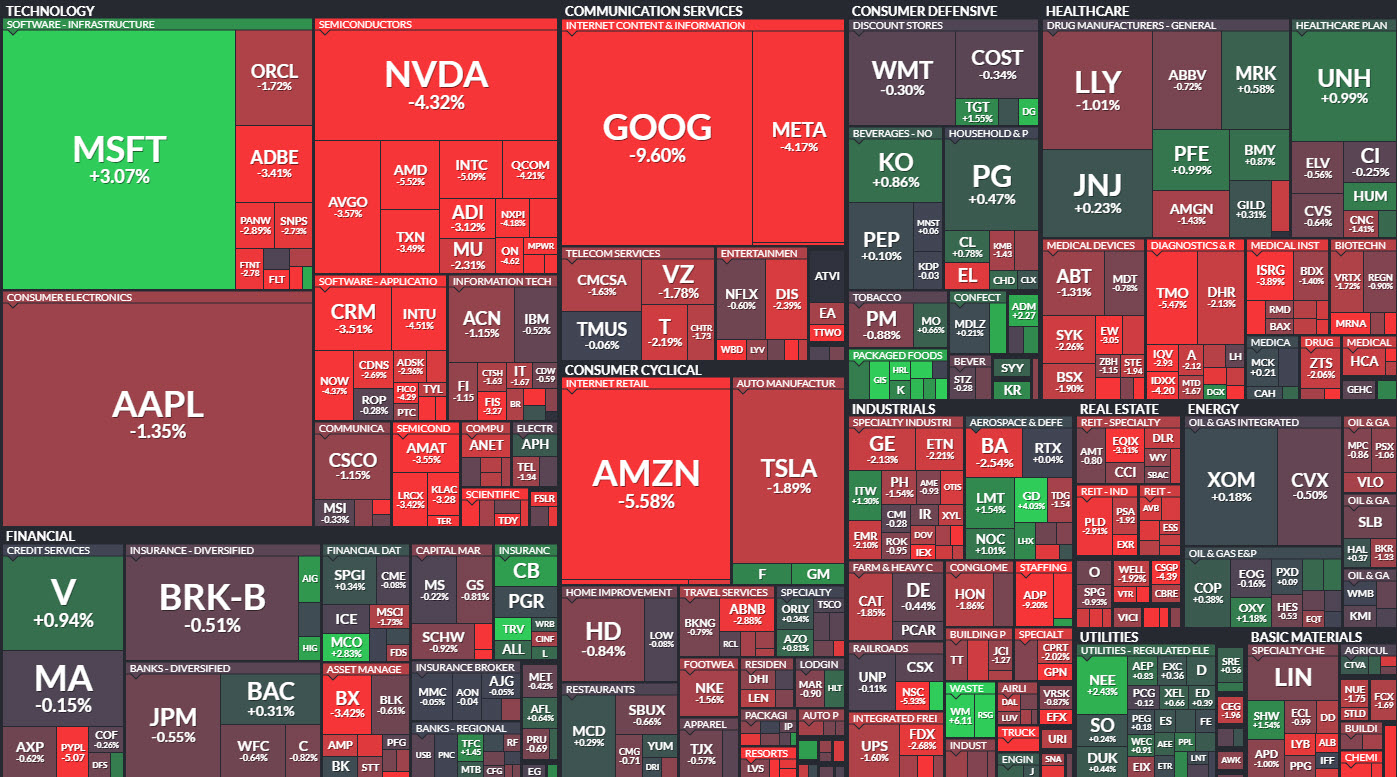
Here’s the single-day heat map illustrating the performance of S&P 500 stocks today. Each stock is depicted as a block, with its size corresponding to its market valuation. The colour of each block signifies whether the stock had a positive or negative performance. Notably, apart from Microsoft, which showed a positive performance, the majority of the ‘Magnificent 7’ tech stocks experienced a challenging day.
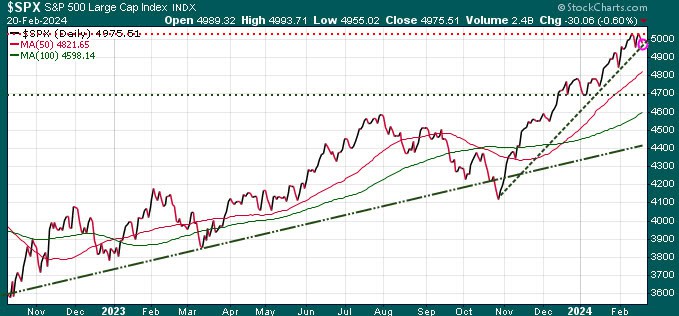
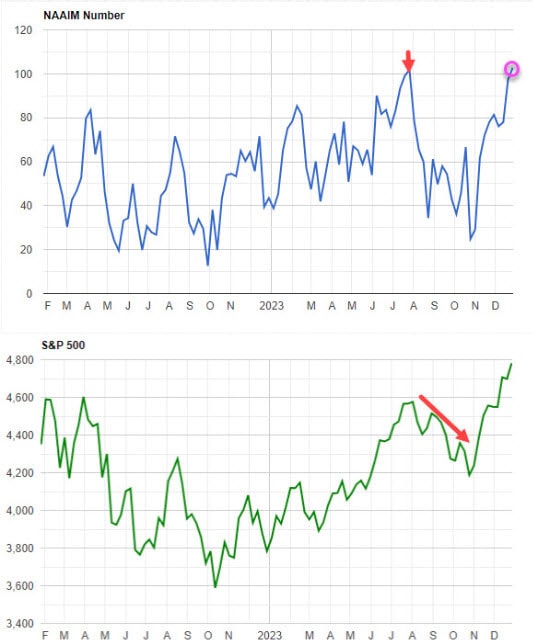
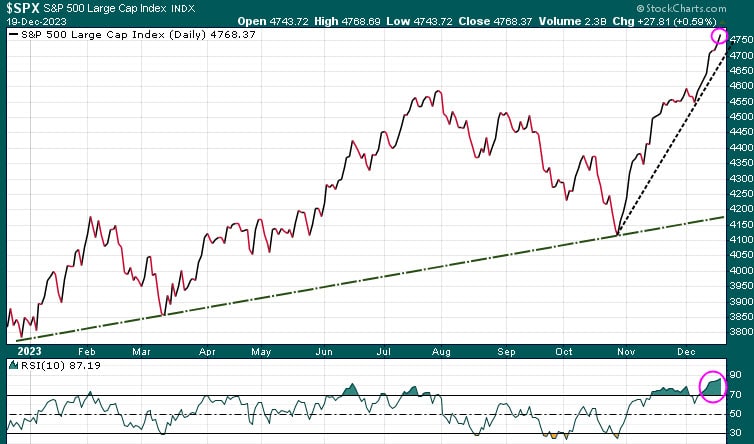
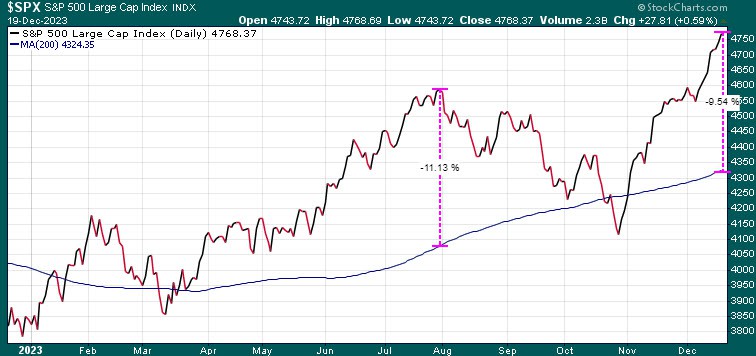
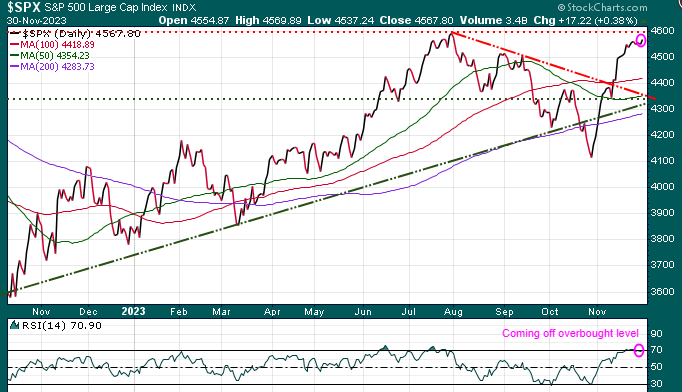
The chart below illustrates the performance of the S&P 500 over the past year. It’s evident that from its upward trajectory starting in October ’22 until mid-July of this year, the index experienced a sustained rally. However, from that mid-July juncture, a significant reversal occurred as several sectors changed direction, leading to a decline of approximately 8.75% in the S&P 500 from that point to today’s level.
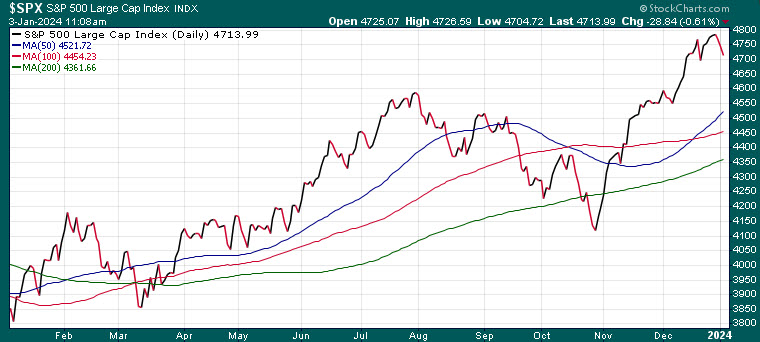
As depicted on the chart, within this reversal, the S&P 500 has breached three critical support levels: the 50-DMA, 100-DMA, and as of today, the 200-DMA. It has also fallen below its year-long uptrend line, marked by the dashed green diagonal line.
This is the first time the market has dropped below its 200-DMA since the March banking crisis and subsequent Fed rescue effort. Falling below the 200-DMA tends to have a psychological impact on market participants, potentially leading to more cautious investment decisions.
When we look at the tech heavy Nasdaq index, we see that while it has breached its 50-DMA and 100-DMA, it is still trading above its 200-DMA. With today’s (Wednesday) decline, the Nasdaq is now flirting with its 200-DMA as well.
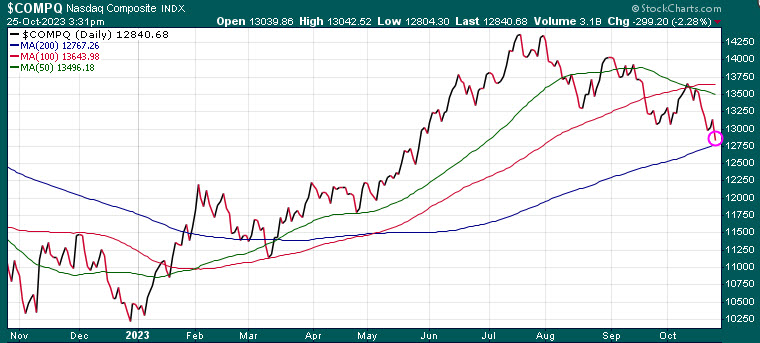
We are seeing some price divergence here, with specific sectors and certain individual stocks trading differently from others. This tends to happen during periods of volatility, often at key turning points. We will be watching this action closely as we enter month end early next week.
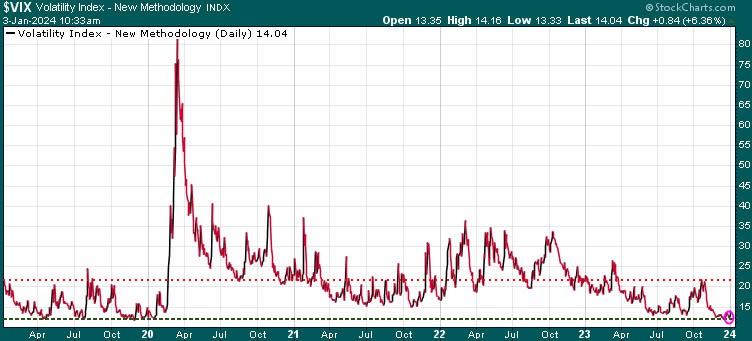
What is causing this volatility?
One of the key headwinds for the markets is clearly the expansion of global wars, with the Middle East grabbing the headlines currently.
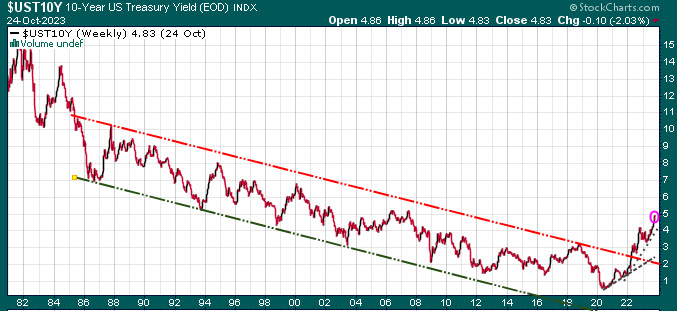
The markets are facing another significant challenge in the form of increasing bond yields, and this rise in borrowing costs is notably affecting small-cap and tech stocks. After experiencing over four decades of declining yields, there has been a notable shift in this trend with yields now on the rise. Here’s a chart depicting the change in the US 10-year yield.
Is a recession still possible?
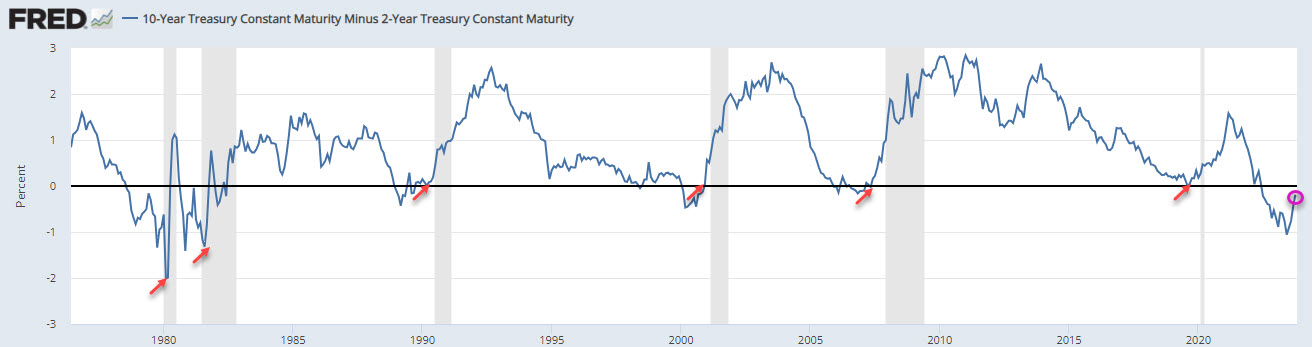
For those not familiar with an inverted yield curve, it is when short-term yields are higher than long-term yields. This seems counterintuitive, as most investors would expect to get more yield for a 10-year bond than say a 2-year bond, as the time risk is much greater. When the yield curve inverts, it means that investors are willing to accept lower yields on long-term bonds than on short-term bonds. This suggests investors are pessimistic about the economy and they are expecting lower rates in the future, so they want to lock in long-term at current rates.
An inverted yield curve has been an incredibly accurate leading indicator of a recession. Since 1955, there has been only one time when the yield curve inverted without there being a recession.
As we can see, the yield curve had been inverted from April’22, so over 18 months. But we can also see with the red arrows that recessions (grey shaded area) typically start after the yield curve starts to revert, which it is doing now. This suggests that a recession is very likely, and the timeframe is getting closer, most likely in the first half of 2024.
A recession is very stressful to individuals and families as unemployment rises, reduced spending hurts small businesses, and real estate tends to decline, reducing equity, making it difficult to get credit.
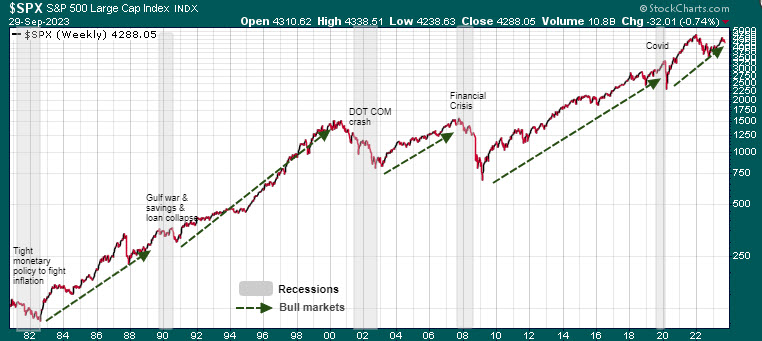
As investors, we need to understand that stocks do not do well in a recession. But, once the recession bottoms, it creates fantastic buying opportunities. Here is a chart showing the last number of recession and we can see the tremendous bull markets once those recessions were over.
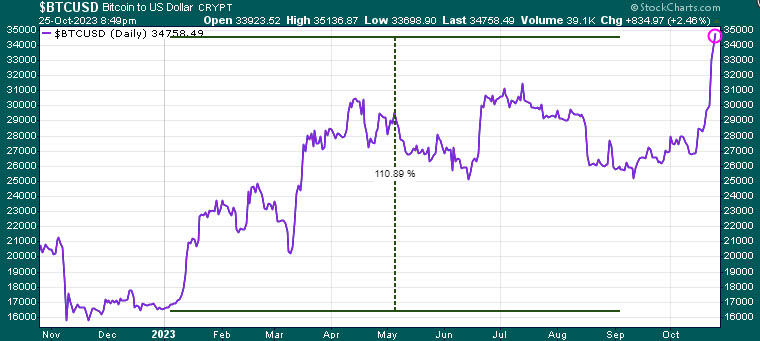
Bitcoin goes parabolic
The price of Bitcoin has gone parabolic with the anticipation of the approval of a Bitcoin spot ETF by the US Securities and Exchange Commission (SEC) which some estimate could add close to 75% to the Bitcoin price within a year. The price of Bitcoin is up ~110% so far this year.
Energy
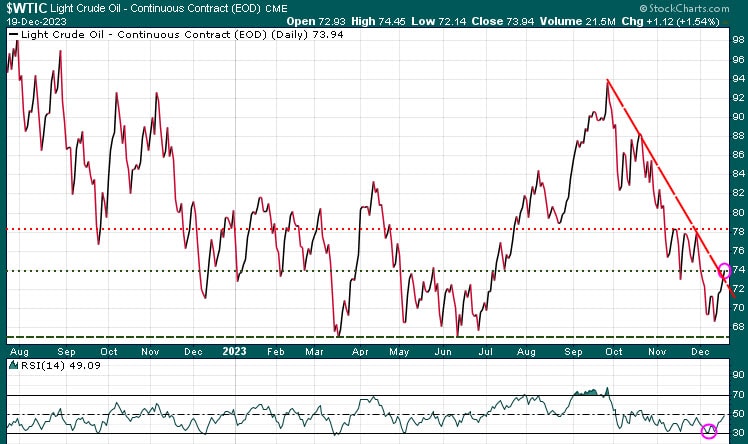
Typically, energy stocks will retreat in tandem with the broader markets. But with the war in the Middle East still very much top of mind, any escalation in that war would boost oil prices and related stocks. Oil just touched our near-term support target at $82.50 and we now need to see if that level holds. If it does, there is the potential to breach the $90.00 mark. Conversely, should this support level falter, we could see oil price drops to below the $80.00 level.
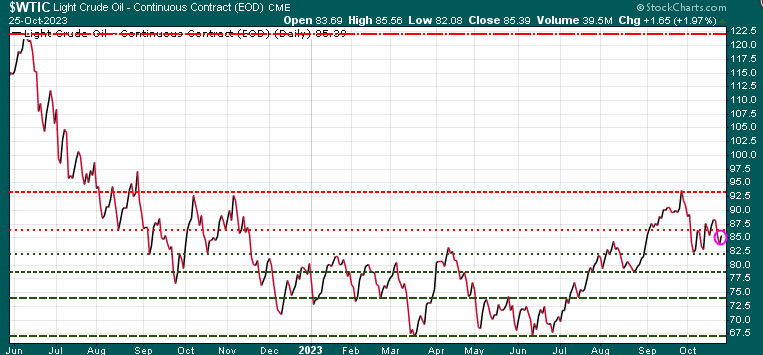
We took some nice profits off the table when oil hit the $93.00 range, and should it pull back here, we will be sending out BUY Signals to subscribers to add to our positions.
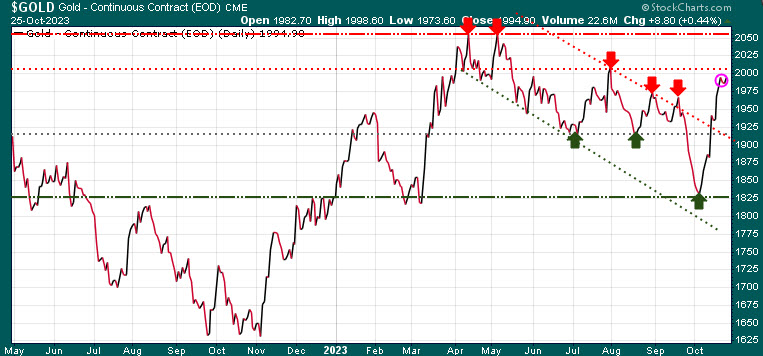
Golds’ glitter
Gold reached our specified target low of 1825 in early October, and then the surge in geopolitical tensions following the attack on Israel attracted risk-on capital into the precious metal. We issued an additional gold trade recommendation for our subscribers, and now we are monitoring gold’s potential movements.
At its recent intraday peak of $2009 last week, gold had surged by over $180.00 from that low point. In the short term, there is resistance at $2000, followed by the previous high at $2060. Key support levels to watch for are $1950, $1925, and the robust support at $1825.
From a technical perspective, gold appears to be overbought at this stage, although it could consolidate within this range. Given its heightened sensitivity to geopolitical risk, a move to test $2060 remains a distinct possibility.
In response to numerous requests, we’ve chosen to reopen our Special Offer from the previous month, considering the heightened market volatility. Click the button below to access those specials with between 40%-65% off regular prices.
Stay tuned!
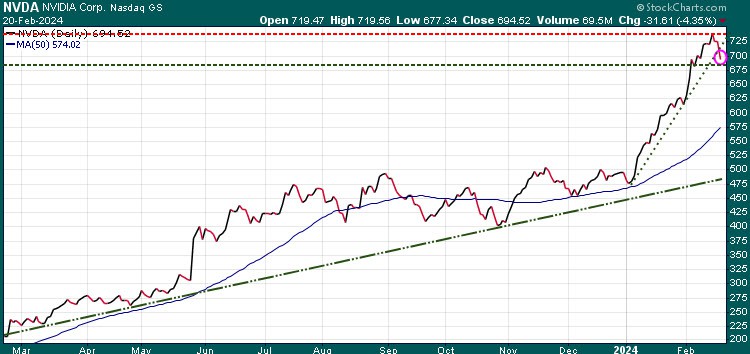
 • Nvidia Stock Analysis: Rebound Incomi…