Many investors ignore the bond market as it is not as ’sexy’ as the stock market. What most fail to understand is that the global bond market is much larger than the stock market, according to Standard & Poors, the global bond market is close to $123.5 trillion (2020 totals), with $46 trillion of that in the US. By comparison, the global stock market

To be a successful investor you need to follow the global flow of capital. If you want to understand what is happening in the markets and why, you need to know what is happening in  the bond markets.

There are a few of ways to make money by investing in bonds:

  • Buy and hold bonds to maturity and collect interest payments, usually twice a year.
  • The second way is to is to profit by selling the bond at a price that’s higher than you paid for it
  • The third option, one that most aren’t aware of, is to use Exchange traded funds (ETF) which allow you to be long or short bonds. ETFs trade just like stocks, and you can buy or sell them with a click of your mouse.

We cover bonds, currencies, equities, commodities and precious metals in the Trend Letter, which is published for subscribers every Sunday afternoon.

Market Notes

Market Action Amid Global Tensions

We labeled Friday’s update as ‘Today’s Market Activity: A Critical Factor for Potential BUY Signals.’ However, over the weekend, a conflict erupted in the Middle East. On Monday, the financial markets opened predictably to the Hamas attack on Israel, producing a near-term decline, but then surprisingly, the markets rallied, with the S&P500 closing up 27 points.

So far, here on Tuesday morning, that rally has continued, with the S&P 500 up ~40 points at time of this writing.

Whenever global conflicts arise, the US bond market often emerges as a ‘safe haven’ investment option. This trend was evident on Monday as the sharp decline in bond prices began to reverse, resulting in higher bond values and lower yields.

In Friday’s update, we highlighted the S&P 500 was testing its critical support level, and when it held, we issued a BUY Stop signal, which was triggered on Monday.

We also issued a BUY Stop signal for a gold trade, which hasn’t yet triggered.

Subscribers can anticipate receiving more signals from us, potentially in the next day or two, as we keep a close eye on the energy sector, cannabis, and even the homebuilders for potential opportunities.

Upcoming this week are the PPI and CPI inflation data in the US, so any upside surprise in either of those could send bond yields spiking again, so we need to tread carefully.

Lastly, our exclusive Special Offer, offering discounts ranging from 40% to 65% off regular prices closes at the end of the day TODAY.  It’s your money, take control!

Stay tuned!

No BUY Signal just yet

As an investment newsletter, we strive to bring the best information to assist those who want to become better, more successful investors.

Bond yields:

Investing in bonds. The recent market turmoil is predominantly driven by concerns over long-term bonds and their elevated yields, as investors brace for the prospect of enduring high borrowing costs. The underlying issue for the long bond market stems from the ongoing accumulation of substantial deficits and debt by the US government, compounded by the fact that China and Japan, historically the largest purchasers of US bonds, are now sellers of them.

Currently, the US is making interest payments of $909 billion on its debt, as reported by the Federal Reserve. With the primary buyers of US debt transitioning into sellers, a pressing question emerges: who will step in to purchase this debt? As potential buyers remain on the sidelines, market dynamics are pushing yields higher in an attempt to attract new investors.

Remember, the Fed only controls the short-term rates, the market controls long-term rates.

Equities:

Investing in stocks. Although the recent selloff in equities showed some signs of slowing down on Wednesday, investors remain vigilant for any potential resurgence in volatility, particularly if the upcoming US non-farm payrolls data on Friday exceeds expectations. On Wednesday, the S&P 500 made a noteworthy rebound, surging by 34.30 points to reach 4,263.70, thanks to early buyers stepping in. However, as of this moment, it has started the day with a lower opening and has retraced much of those gains, currently down by 25.39 points.

Oil:

Investing in oil. In our previous Trend Letter last week, we anticipated a retracement in oil prices from their peak at 94.00, prompted by an elevated Relative Strength Index (RSI) reading of 78.00, with any reading above 70 indicating an extreme overbought condition. Subsequent to reaching that high, oil has experienced a decline of approximately 10.00, settling around our initial support marker at $86.00, concluding Wednesday’s session at 84.22. This morning, there has been a slight uptick, but at the time of this writing, the market remains relatively flat. Our next anticipated support level for oil stands at 79.70, and we expect it to test that level in the near future.

Gold:

Investing in gold. Gold continued its struggles Wednesday, down ~7.00 to 1834.80. Over the past few months our projected lower target for gold has been 1825. At the time of this writing gold is trading at 1828 and is exhibiting oversold conditions. We are on the verge of our models issuing a BUY Signal, but it hasn’t triggered it yet.

It’s essential to emphasize that we are trend traders, requiring more than just an oversold market condition. The market must exhibit a convincing rally potential. While we believe we are approaching that point, confirmation is still pending.

As soon as we receive that confirmation, we will promptly notify our subscribers. If you haven’t subscribed yet, our exclusive Special Offer, providing discounts ranging from 40% to 65% off regular prices, remains accessible until this Saturday. It’s your money, take control!

Stay tuned!

Market Notes

Navigating the Currents of Rising Interest Rates and Market Uncertainties

Rising yields

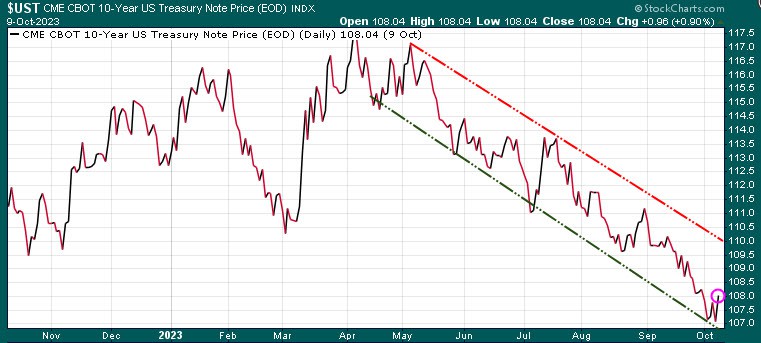
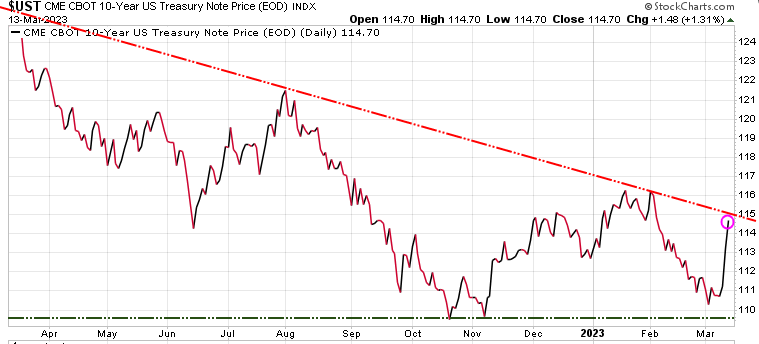
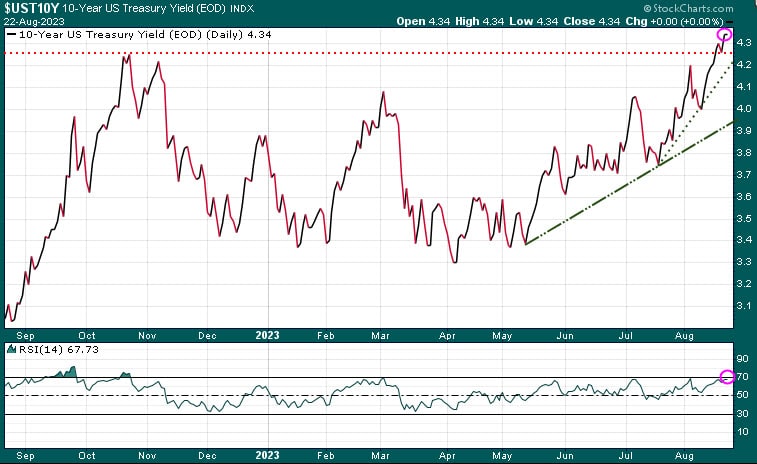
The significant surge in interest rates throughout 2022 has been extensively documented and has deeply impacted investors, leading to diminished performance in both the stock and bond (debt) markets over the past year. Coming into 2023, the common theory was that the pronounced and continuous escalation of rates would ease, as the primary focus would shift from combating high inflation to addressing slower growth. Although this scenario did play out during much of the current year, longer-term rates has seen a marked increase in recent weeks. Notably, the 10-year Treasury yield reached its highest point since 2007 this week.

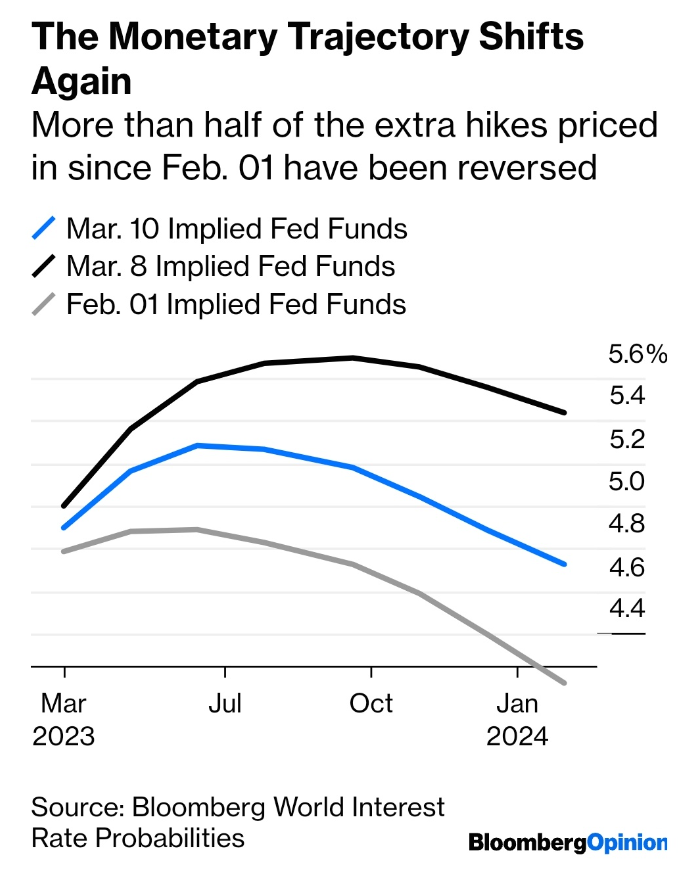
As highlighted in recent Trend Letter updates, the notable increase in interest rates can be attributed primarily to a shift in perceptions surrounding the Federal Reserve’s policy. The previously optimistic view held by the market, anticipating swift changes in the Fed’s stance including potential rate cutbacks, has encountered a dose of reality. The persistent strength in economic growth is leading the markets to now acknowledge that the Fed intends to do as it has been saying it intended to do, keep its policy rate ‘higher for longer.’ This adjustment is now manifesting in higher longer-term yields.

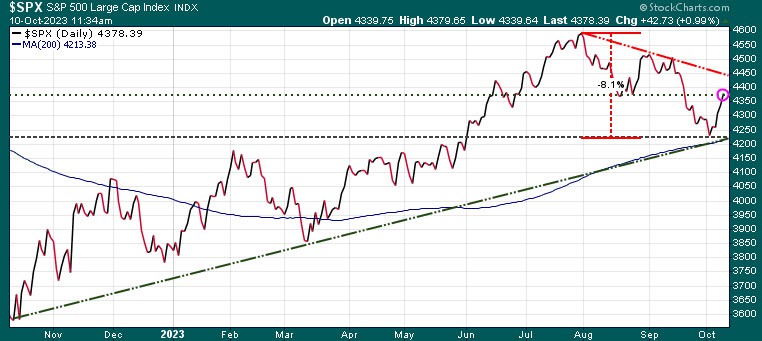
As we look at the bottom of the chart, we can see that based on RSI, this rise in yields is getting technically overdone. Fed Chair Powell speaks from Jackson Hole on Friday, and should he be overly hawkish, these yields will move even higher. Conversely, a dovish tone in his communication could potentially prompt a moderation in rates.
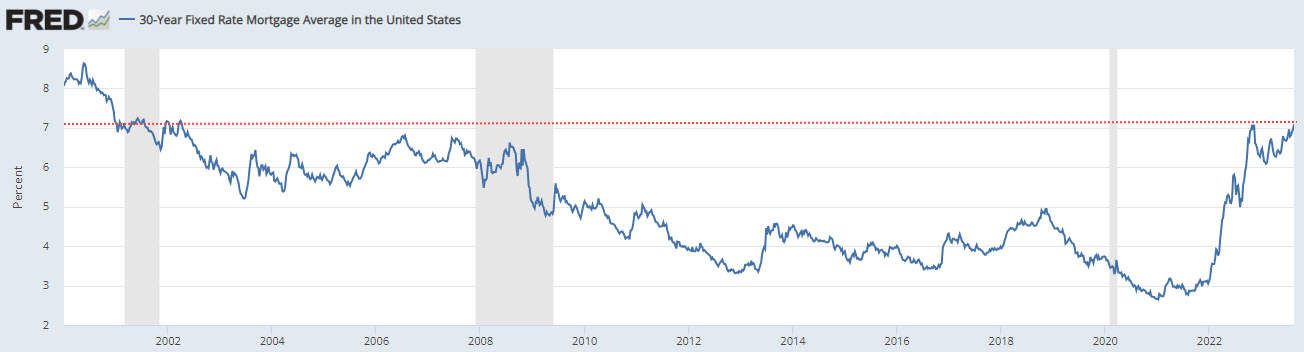
Mortgage rates

Naturally, with the increase in the 10-year yield, there is a corresponding uptick in mortgage rates. Presently, 30-year mortgage rates in the US have surpassed 7%, marking their highest point since April 2002.

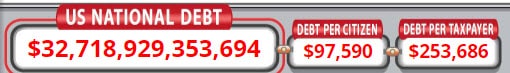
Massive government debts

In their efforts to rein in inflation, the Bank of Canada and the US Federal Reserve are confronted with a significant adversary: the substantial fiscal outlays by their respective federal governments. In the case of the US, within the initial 52 business days after the debt ceiling accord was reached in early June, government expenditure has reached an astounding $1.72 trillion. This equates to an average daily expenditure exceeding $33 billion.

As these governments intensify their spending and subsequently accumulate more debt, they must then secure additional funds to support these financial outlays. Consequently, they find themselves compelled to repeatedly access the bond market to issue more bonds. This sequence of events contributes to the elevation of interest rates, thus heightening inflationary pressures.

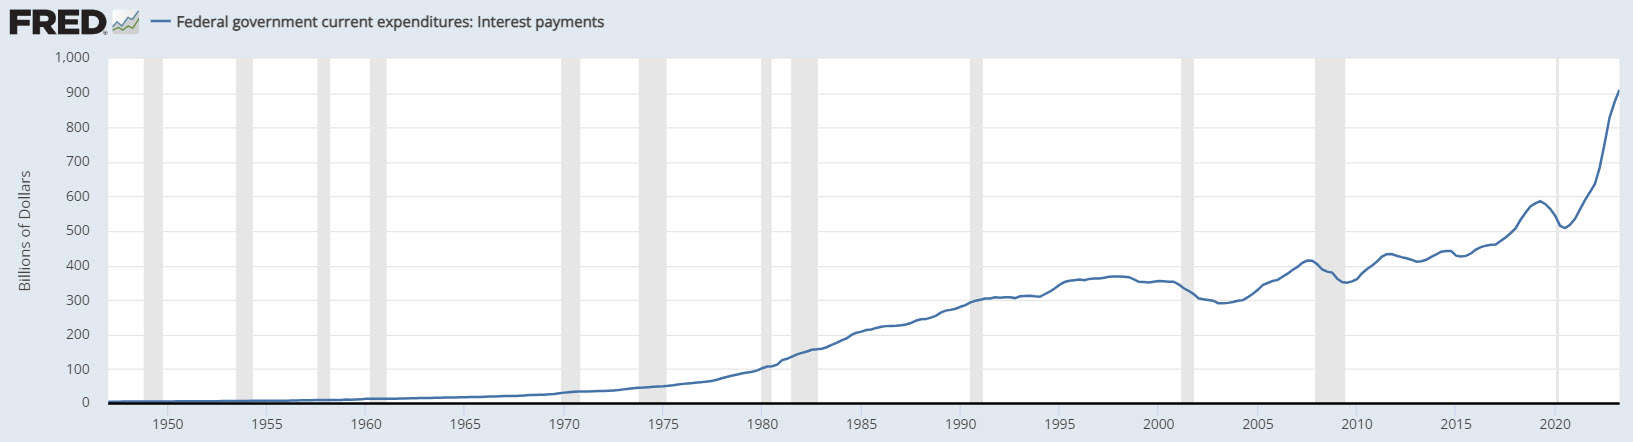
The following visual underscores the level of unsustainability of the US debt. While Canada’s situation may not be as dire as that of the US, the trend is similar.

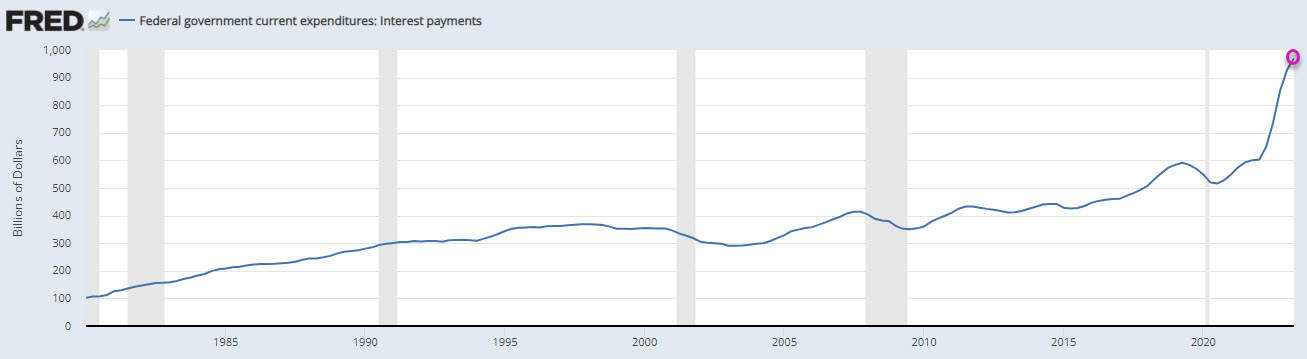
Debt servicing costs

Rising interest rates impact consumers, leading to increased mortgage and loan payments. Governments also face growing financial responsibilities, especially regarding interest on their mounting debt. According to the St. Louis Federal Reserve, the US is currently spending around $970 billion solely on interest payments—a significant allocation for debt servicing, nearing the trillion-dollar mark.

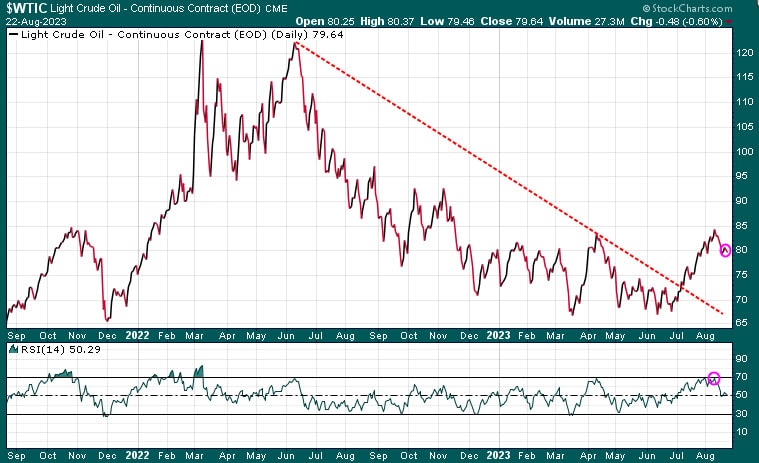
Food and energy inflation

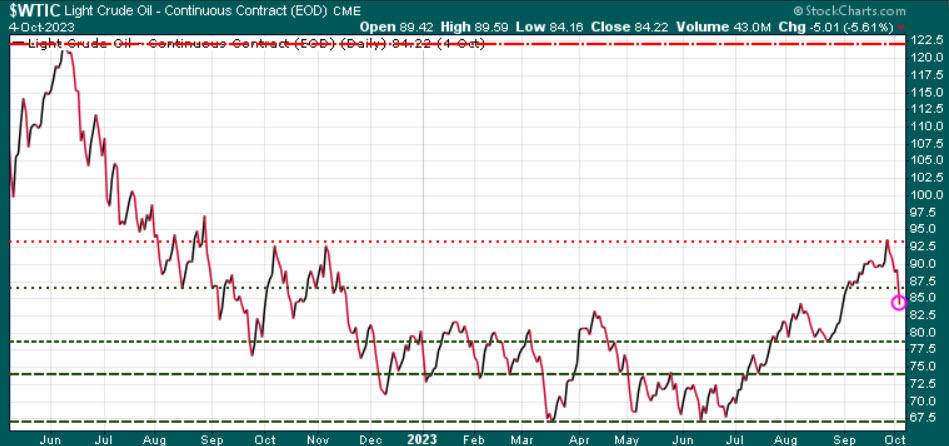
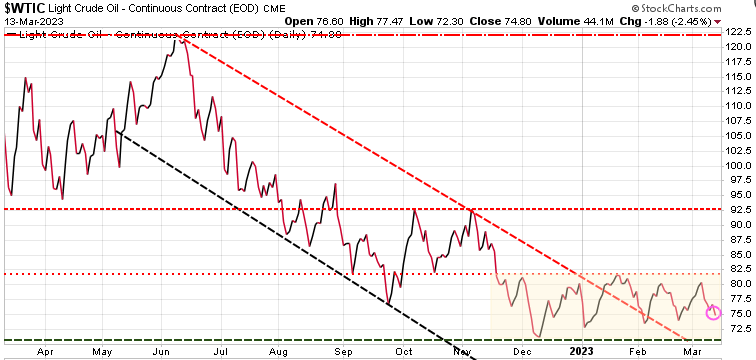
Two other significant contributors to inflation are energy and food. Following its dismal performance in 2022, the oil sector has shown a notable recovery, breaking out of its downward trend. In recent weeks, oil has stood out as a positive performer. The subsequent chart illustrates that oil experienced an overbought condition last week and has since undergone a modest retracement. A potential buying opportunity might present itself if a pullback occurs to the 76.00 level.

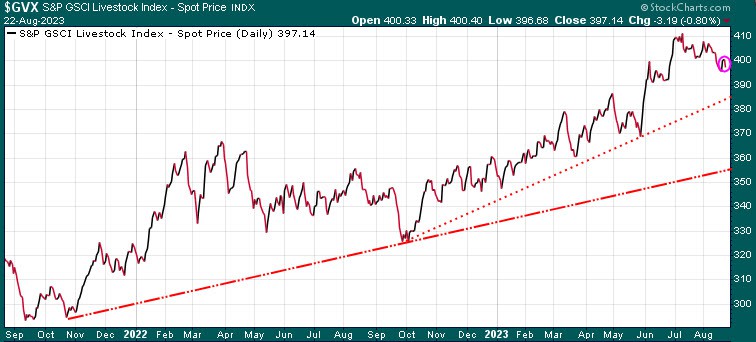
Those who have been recently purchasing beef are well aware of the significant increase in cattle prices that has taken place since October.

Nvidia leads the markets

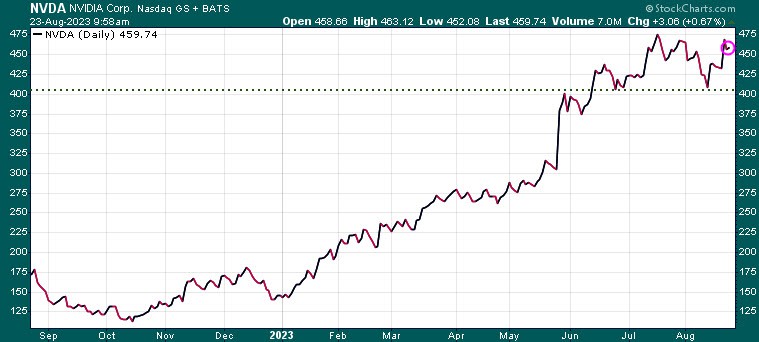
Later today, we have the eagerly anticipated Nvidia earnings report, and later this week, Jerome Powell is scheduled to speak at the Jackson Hole event, both of which represent significant uncertainties for the market. Nvidia is set to release its earnings after Wednesday’s market close, and the prevailing sentiment is that there will be another massive earnings beat and an optimistic projection concerning the demand for artificial intelligence. Analysts from various financial institutions are currently revising their price targets in anticipation of these earnings. It’s worth noting that the stock is currently trading at a valuation of 233 times its earnings, necessitating an extraordinary positive surprise to maintain the remarkable upward trajectory. While there’s always a possibility that Nvidia pulls off the massive earnings beat, we will be watching the 405.00  support level. If that level is breached, we could see much lower levels and it will likely drag the rest of the market down with it.

Fed speak

Federal Reserve Chair Jerome Powell is slated to deliver a speech at 10 AM during the Jackson Hole event on Friday. This presentation has captured the undivided attention of the global financial community. Powell has remained resolute in his mission to combat inflation, all the while suggesting that yields will continue to climb as part of this effort. Up to now, the markets did not believe the Fed, leading to a scenario often described as ‘fighting the Fed.’ The pivotal question now arises: Will the market accept Powell suggesting that stronger growth will require even higher rates?

We keep tabs on all sectors in the Trend Letter and issue a full report each Sunday evening. If you are not a subscriber but would like to get a deeper insight into the driving forces behind these markets, visit us at www.thetrendletter.com or email us at info@thetrendletter.com.

Stay tuned!

We are offering discounted prices for our three services & with each new subscription this week, we will donate $100 to Special Olympics.  See below.

 Trend Letter:
Since start-up in 2002 Trend Letter has provided investors with a great track record, giving exceptionally accurate information about where the markets are going, and it has explained in clear, concise language the reasons why. Using unique and comprehensive tools, Trend Letter gives investors a true edge in understanding current market conditions and shows investors how to generate and retain wealth in today’s climate of extreme market volatility.

A weekly publication covering global bonds, currencies, equities, commodities, & precious metals. Publishes every Sunday evening, covers equites, currencies, precious metals, commodities, and bonds. Each weekly issue is about 50 pages, mostly charts, with key bullet points to make easy to understand. A 10-15 min read

Timer Digest says“Trend Letter has been a Timer Digest top performer in our Bond and Gold categories, along with competitive performance for the intermediate-term Stock category.”


Technical Trader:
Trend Technical Trader (TTT) is a premier hedging service, designed to profit in both up and down markets.

Our hedging strategy empowered  TTT subscribers to not only protect wealth from serious losses during markets crashes, it allowed them to be positioned to make significant gains as markets crashed.

TTT isn’t just a hedging service.  Its timing strategies have returned fantastic gains on the long side. See examples here

Included is our proprietary Gold Technical Indicator (GTI).


Trend Disruptors:
Disruptive technology trends will propel our future and the reality is that no industry will go untouched by this digital transformation. At the root of this transformation is the blurring of boundaries between the physical and virtual worlds. As digital business integrates these worlds through emerging and strategic technologies, entirely new business models are created.

Trend Disruptors is a service for investors seeking to invest in advanced, often unproven technology stocks on the cheap, with the objective to sell them when masses finally catch on. Covering Artificial Intelligence (AI), Virtual Reality (VR), Augmented Reality (AR), 5G, Quantum Computing & many more.

All subscriptions in $US

Special Offers

ServiceRegular PriceSpecial PriceSavingSubscribe
Trend Letter$599.95$349.95$250Trend Letter $349.95
Technical Trader$649.95$349.95$300 Trend Technical Trader $349.95
Trend Disruptors$599.95$349.95$250 Trend Disruptors $349.95
Better Deals
Trend Letter + Technical Trader$1,249.90$549.95$699.95 Trend Letter & Technical Trader $549.95
Trend Letter + Trend Disruptors$1,199.90$549.95$649.95 Trend Letter & Trend Disruptors $549.95
Technical Trader + Trend Disruptors$1,249.90$549.95$699.95 Technical Trader & Trend Disruptors $549.95
Best Deal
Trend Suite: Trend Letter + Technical Trader + Trend Disruptors$1,849.85$649.95$1,199.90 Trend Suite: TL + TTT + TD $649.95
Market Notes

Market Notes – March 13/23

US stocks finished Monday mixed as volatile trading gripped Wall Street after federal banking regulators took aggressive actions to stem the fallout of Silicon Valley Bank’s failure.

First Republic Bank led a decline in bank shares Monday that came even after regulators’ extraordinary actions Sunday evening to backstop all depositors in failed Silicon Valley Bank and Signature Bank and offer additional funding to other troubled institutions. First Republic is now down ~80% since February 2/23.

Many of the bank stocks were halted repeatedly for volatility throughout the day.

With fear of a banking crisis, bonds spiked as investors ran to safety.

With the collapse of these banks, the market is now changing its tune on Fed rate hikes.

The $US was down with expectations that the Fed will slow their rate hike efforts. We will see.

Gold spiked higher as a safe-haven play.

Oil continued its decline. Could be seeing a great buying opportunity soon.

US CPI data is out  tomorrow.

Stay tuned!

Market Notes

Market Notes – June 13/22

The S&P 500 dropped back into a bear market within the first 30 minutes of trading today. The index is now down over 20% from its January high, marking the lowest level since March 2021. The Dow plummeted 2.79% while the Nasdaq fell 4.8%. Recession fears are growing amid crippling inflation and people are pulling out of their positions before the situation worsens.

For the last six months we have warned that in bear markets, relief rallies typical fail to make new highs and in fact tend to make new lows.  Our Trend Letter and especially our Trend Technical Trader (TTT) services have been using hedging strategies to protect our portfolios from these violent bear markets and even to profit from them.

Bear markets typically have three phases. The first stage is a sharp decline, followed by a rebound, and then a drawn-out fundamental downtrend. This is likely where we are now and we are likely to see some strong relief rallies, followed by deep corrections.

If you have yet to put any hedging strategies in place, we should be due for a rally very soon, which would be an opportunity to put in such a strategy.  If you need assistance on how to hedge, seriously think about subscribing to TTT at a 50% discount. Click here to subscribe.

The Nasdaq representing the tech stocks is now down over 32% since its high in November.

The S&P 500 is now officially in a bear market, having dropped over 21% since its high at the start of January.

The Canadian TSX has fared much better thanks to energy sector. The TSX is down ~10% and has not yet hit new lows.

Volatility spiked over 22% today.

The $US continues to be a safe-haven play in this bear market, testing recent high.

On Friday Gold jumped along with the $US as a safe-haven play. Today it fell off – very inconsistent and frustrating!

Stay tuned!