Throughout history, few investments have rivaled investing in gold for popularity as a hedge against many economic problems, from inflation, to economic upheaval or currency fluctuations, to war.

When you think about investing in gold, don’t restrict yourself to just buying physical gold, like coins or bullion. Alternatives to invest in gold include buying shares of gold mining companies or gold Exchange Trade Funds (ETFs). You can also invest in gold by trading options and futures contracts.

Physical Gold

Investing in physical gold can be challenging for investors more accustomed to trading stocks and bonds online. When it comes to physical gold, you’ll generally be interacting with dealers outside of traditional brokerages, and you’ll likely need to pay for storage and obtain insurance for your investment. The three main options to invest in physical gold are bullion, coins and jewelry.

Buying Gold Miner Stocks

Companies that specialize in mining and refining will also profit from a rising gold price. Investing in these types of companies can be an effective way to profit from gold, and can also carry lower risk than other investment methods.

Investing in Gold ETFs

Investing in gold ETFs  can provide you with exposure to gold’s long-term stability while offering more liquidity than physical gold and more diversification than individual gold stocks. There are a range of different types of gold funds. Some are passively managed index funds that track industry trends or the price of bullion using futures or options.

An investor can also invest  in ETFs that hold a basket of gold mining stocks. An example is the VanEck God Miners ETF (GDX.NYSE) which holds many of the major gold mining producers.  For investors wanting to be more aggressive and buy ore speculative mining companies, the VanEck Junior Gold Miner ETF (GDXJ.NYSE) is available.

No BUY Signal just yet

As an investment newsletter, we strive to bring the best information to assist those who want to become better, more successful investors.

Bond yields:

Investing in bonds. The recent market turmoil is predominantly driven by concerns over long-term bonds and their elevated yields, as investors brace for the prospect of enduring high borrowing costs. The underlying issue for the long bond market stems from the ongoing accumulation of substantial deficits and debt by the US government, compounded by the fact that China and Japan, historically the largest purchasers of US bonds, are now sellers of them.

Currently, the US is making interest payments of $909 billion on its debt, as reported by the Federal Reserve. With the primary buyers of US debt transitioning into sellers, a pressing question emerges: who will step in to purchase this debt? As potential buyers remain on the sidelines, market dynamics are pushing yields higher in an attempt to attract new investors.

Remember, the Fed only controls the short-term rates, the market controls long-term rates.

Equities:

Investing in stocks. Although the recent selloff in equities showed some signs of slowing down on Wednesday, investors remain vigilant for any potential resurgence in volatility, particularly if the upcoming US non-farm payrolls data on Friday exceeds expectations. On Wednesday, the S&P 500 made a noteworthy rebound, surging by 34.30 points to reach 4,263.70, thanks to early buyers stepping in. However, as of this moment, it has started the day with a lower opening and has retraced much of those gains, currently down by 25.39 points.

Oil:

Investing in oil. In our previous Trend Letter last week, we anticipated a retracement in oil prices from their peak at 94.00, prompted by an elevated Relative Strength Index (RSI) reading of 78.00, with any reading above 70 indicating an extreme overbought condition. Subsequent to reaching that high, oil has experienced a decline of approximately 10.00, settling around our initial support marker at $86.00, concluding Wednesday’s session at 84.22. This morning, there has been a slight uptick, but at the time of this writing, the market remains relatively flat. Our next anticipated support level for oil stands at 79.70, and we expect it to test that level in the near future.

Gold:

Investing in gold. Gold continued its struggles Wednesday, down ~7.00 to 1834.80. Over the past few months our projected lower target for gold has been 1825. At the time of this writing gold is trading at 1828 and is exhibiting oversold conditions. We are on the verge of our models issuing a BUY Signal, but it hasn’t triggered it yet.

It’s essential to emphasize that we are trend traders, requiring more than just an oversold market condition. The market must exhibit a convincing rally potential. While we believe we are approaching that point, confirmation is still pending.

As soon as we receive that confirmation, we will promptly notify our subscribers. If you haven’t subscribed yet, our exclusive Special Offer, providing discounts ranging from 40% to 65% off regular prices, remains accessible until this Saturday. It’s your money, take control!

Stay tuned!

Market Notes – September 1/23

Some investment news for those looking to invest in gold, invest in stocks, or currencies, and commodities.

Each week the Trend Letter, displays weekly heat map of the S&P 500. It is a great visual of the equity market that holds stocks many North Americans own. Each of the 500 stocks is shown in a box, & the size of the box represents its market valuation, and the colour of each box tells you how that stock did, GREENS being gains & REDS being losses.

As we can see, for the week, big tech stocks led the way higher. There was also a lot of green throughout most other  sectors, with utilities and healthcare being the main exceptions.

On the daily heatmap a bit of a different story, with some big tech in red.

Looking at the BIG picture, the S&P 500 is still solidly in a long-term uptrend channel, since 2009. If we were to test the initial support level  of that long-term uptrend channel, we would see a correction to the 4000 level, which would be a ~11% decline  from the current 4500 range

Based on seasonality, September is the weakest month for the S&P 500.

If we do get a decent correction in September, it could provide a good buying opportunity. Sectors that have looked good are oil, uranium, tech, gold, base materials and even cannibals cannabis, what with US health dept urging the DEA to relax restrictions. We will see if these will remain strong after Labour Day, or if the negative September seasonals take over.

What we do at Trend Letter is track those key support & resistance levels, looking for changes in trend, and then and alert subscribers when trends change.

In Martin’s interview with Jim Goddard on This Week in Money on Friday (interview start at 44:39), he promised to show the chart below. If we look at the last number of times the Fed CUT rates recently, so 2000, 2007 and 2020…each time was driven by the economy falling into a recession (grey shaded bars). And when they CUT rates (red arrows) the S&P 500 had sharp declines. In each of those CUTTING phases it was not until the Fed STOPPED cutting rates that the S&P 500 started to recover (green arrows).

For those investing in gold, the key numbers are::

  • Near-term resistance is 2000, 2040, then 2070, which was that double top in April-May
  • Next key support level is 1915, 1900, 1880, then & really strong support at 1825
  • If it does drop to 1825, that would likely trigger several new BUY alerts

In Martin’s interview with Jim Goddard, he explained why he still feels a recession is very possible. He outlined the two key leading indicators, the inverted yield curve and the Conference Board’s Leading Economic Index (LEI).  Both of these have an almost perfect record in forecasting recessions. Both are forecasting a recession coming soon.

A yield curve is inverted when short-term yields are higher than long-term yields. An inverted yield curve is a leading indicator of a recession and since 1955 (68 years), there has been only one time where the yield curve inverted without there being a recession.Recently, the yield curve is the most inverted it has been in over 40 years. Recessions don’t start when the yield curve inverts, but rather when it starts to ‘uninvert’ (red arrows).

This chart clearly shows that for each of the last 6 recessions, they all started after the yield started to rise. Today, the yield curve is starting to ’uninvert’ (circle).

The other indicator with a near perfect record of forecasting a recession is the Conference Board’s Leading Economic Index, which looks at 10 components across the US economy. That index, again in its latest report last week, is firmly saying a recession is coming.


Oil has had a great week after dropping down to the 80.00 level, it has rallied big time this week, and closed Friday at 85.55.  The big bump this week came after a massive 11.5 million barrel drawdown in US crude inventories. Also, we have the Saudi Arabia production falling and they, plus potentially Russia, are expected to extend the production cuts into the end of October.

Stay tuned!

We are offering discounted prices for our three services and with each new subscription this week, we will donate $100 to Special Olympics.  See Special Offers below.

 Trend Letter:
Since start-up in 2002 Trend Letter has provided investors with a great track record, giving exceptionally accurate information about where the markets are going, and it has explained in clear, concise language the reasons why. Using unique and comprehensive tools, Trend Letter gives investors a true edge in understanding current market conditions and shows investors how to generate and retain wealth in today’s climate of extreme market volatility.

A weekly publication covering global bonds, currencies, equities, commodities, & precious metals. Publishes every Sunday evening, covers equites, currencies, precious metals, commodities, and bonds. Each weekly issue is about 50 pages, mostly charts, with key bullet points to make easy to understand. A 10-15 min read

Timer Digest says“Trend Letter has been a Timer Digest top performer in our Bond and Gold categories, along with competitive performance for the intermediate-term Stock category.”


Technical Trader:
Trend Technical Trader (TTT) is a premier hedging service, designed to profit in both up and down markets.

Our hedging strategy empowered  TTT subscribers to not only protect wealth from serious losses during markets crashes, it allowed them to be positioned to make significant gains as markets crashed.

TTT isn’t just a hedging service.  Its timing strategies have returned fantastic gains on the long side. See examples here

Included is our proprietary Gold Technical Indicator (GTI).


Trend Disruptors:
Disruptive technology trends will propel our future and the reality is that no industry will go untouched by this digital transformation. At the root of this transformation is the blurring of boundaries between the physical and virtual worlds. As digital business integrates these worlds through emerging and strategic technologies, entirely new business models are created.

Trend Disruptors is a service for investors seeking to invest in advanced, often unproven technology stocks on the cheap, with the objective to sell them when masses finally catch on. Covering Artificial Intelligence (AI), Virtual Reality (VR), Augmented Reality (AR), 5G, Quantum Computing & many more.

All subscriptions in $US

Special Offers

ServiceRegular PriceSpecial PriceSavingSubscribe
Trend Letter$599.95$349.95$250Trend Letter $349.95
Technical Trader$649.95$349.95$300 Trend Technical Trader $349.95
Trend Disruptors$599.95$349.95$250 Trend Disruptors $349.95
Better Deals
Trend Letter + Technical Trader$1,249.90$549.95$699.95 Trend Letter & Technical Trader $549.95
Trend Letter + Trend Disruptors$1,199.90$549.95$649.95 Trend Letter & Trend Disruptors $549.95
Technical Trader + Trend Disruptors$1,249.90$549.95$699.95 Technical Trader & Trend Disruptors $549.95
Best Deal
Trend Suite: Trend Letter + Technical Trader + Trend Disruptors$1,849.85$649.95$1,199.90 Trend Suite: TL + TTT + TD $649.95
Market Notes

Market Notes – May 19/23

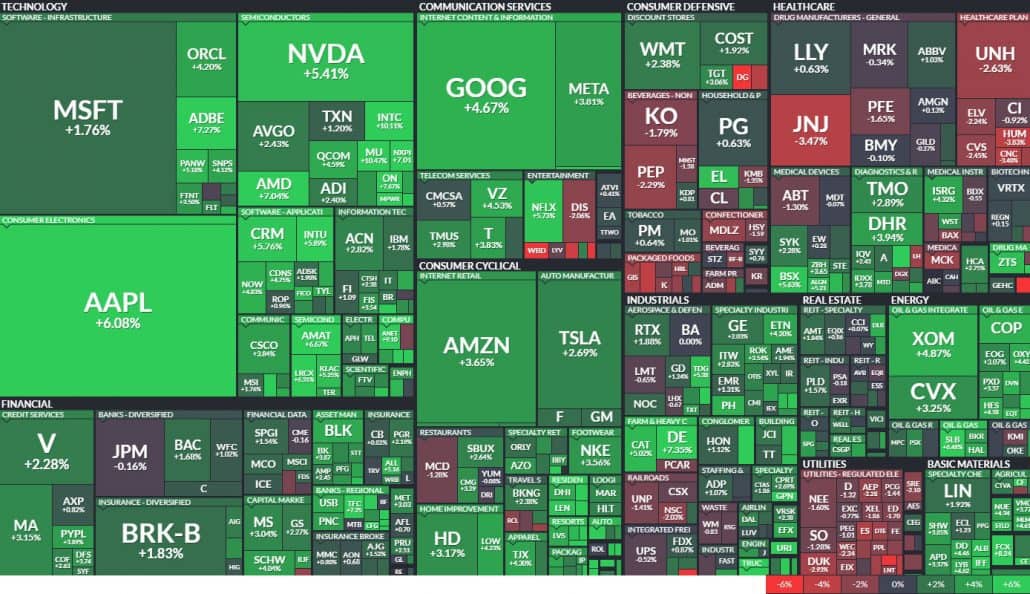
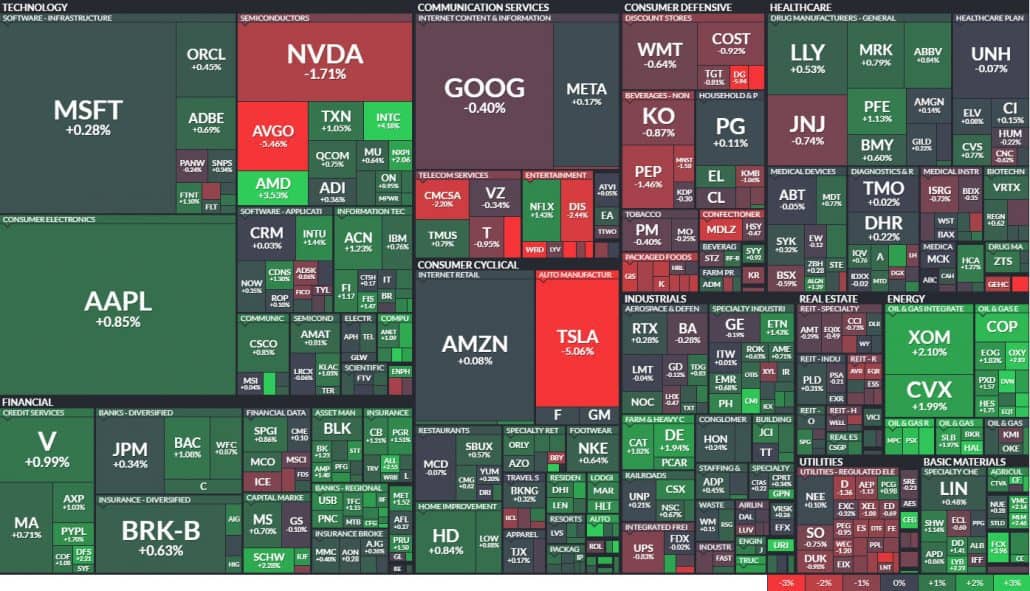
After receiving positive updates from retailers that reinforced the absence of an impending recession, the stock market surpassed the trading range that had confined it since February. This breakthrough triggered significant short covering and a surge of investment in the technology sector index, once again spearheaded by the mega-cap companies, as we have highlighted all year.

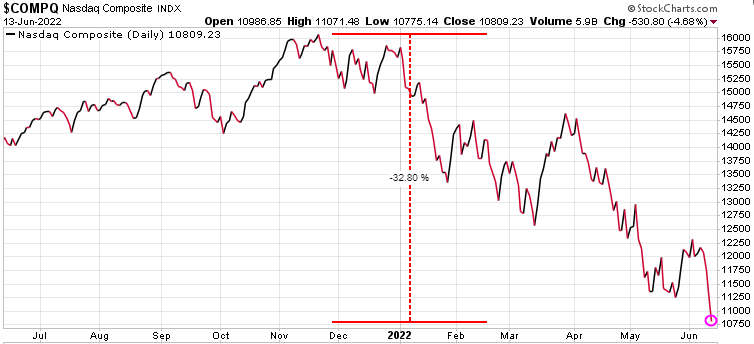
Once again, Big Tech, and mainly the 8 Big Tech stocks have accounted for almost all of the gains for the year in the broad markets. The Nasdaq 100 has jumped to a new all-time high this week, and Microsoft and Apple now make up 14% of the S&P 500 market cap. Combined, they have added over $1 trillion in value so far in 2023.

If not for the AI frenzy, stock indices would be down for the year, So, it’s been a very distorted bullish rally.

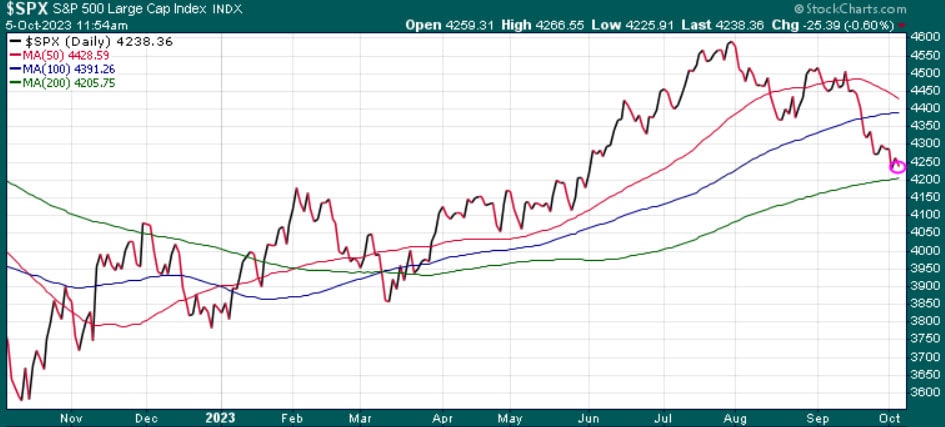
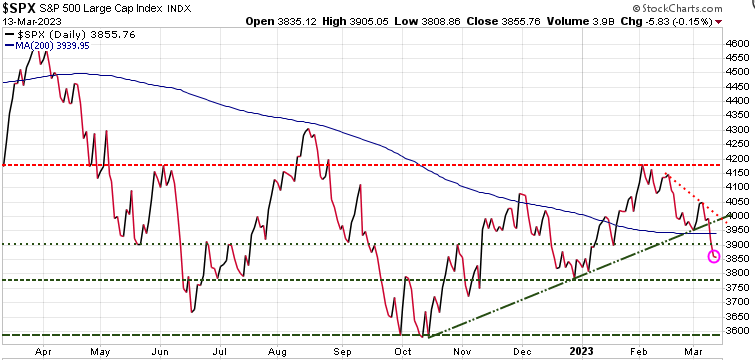
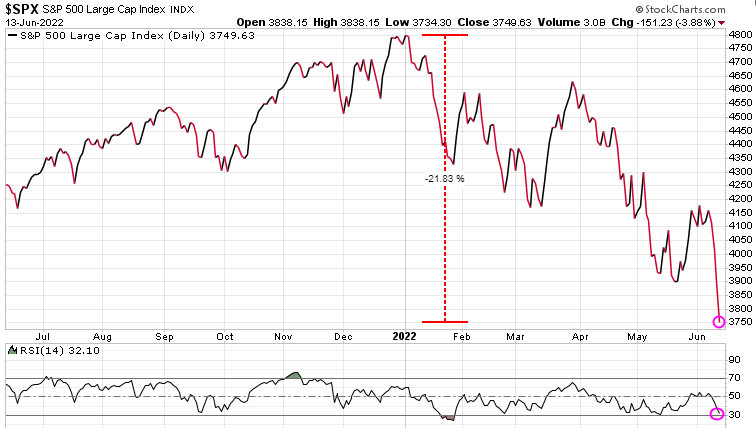
After three failed attempts (red arrows) since February, the S&P 500 broke above its key resistance level of 4175. If it can break and hold above 4200, then it could have a rally and test the August high at 4305. A break below 4050 would open the door for a more significant decline.

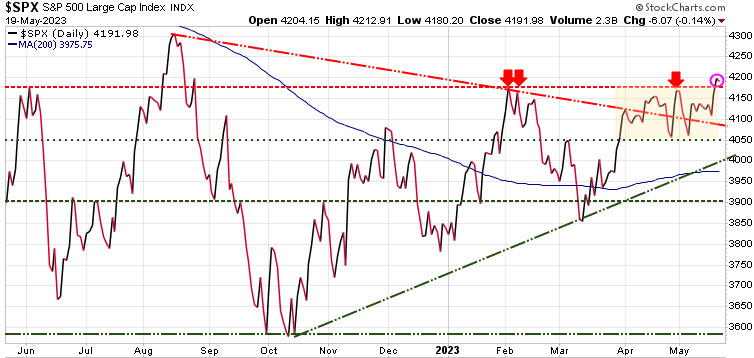
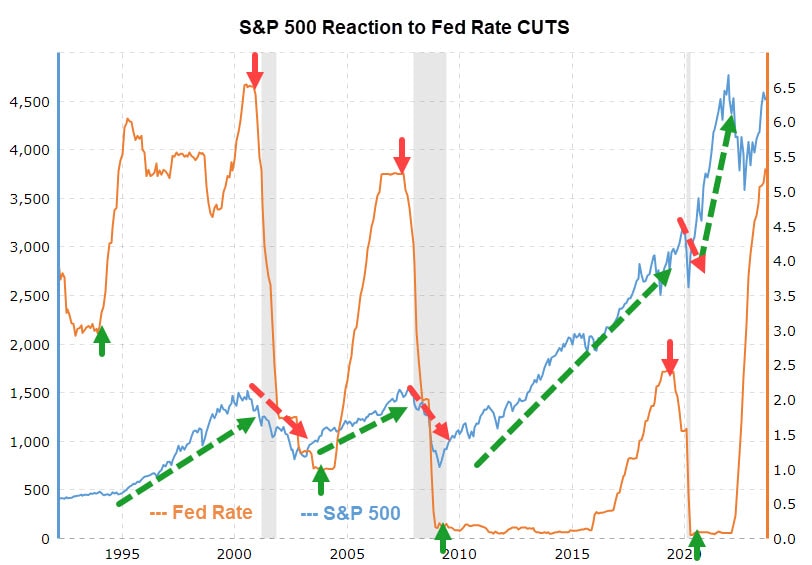
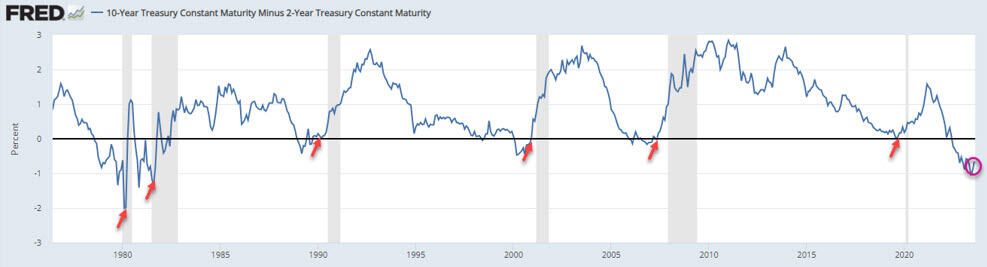
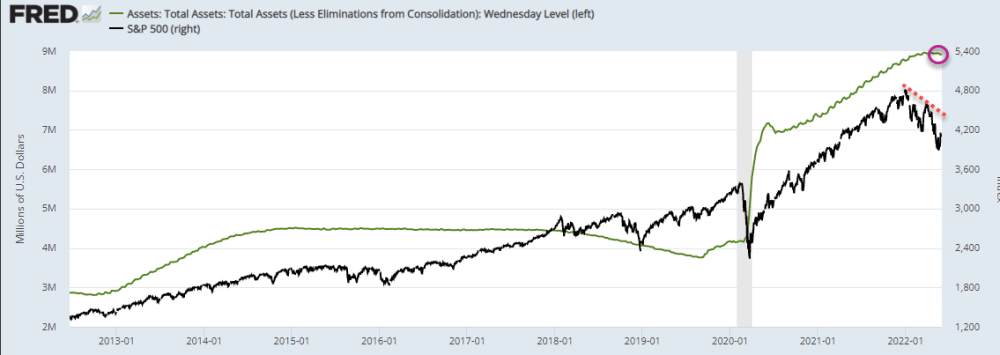
In speaking on This Week in Money, Martin was asked if the Fed starts cutting rates will it jump start the  markets. While the masses believe that to be true. Martin highlighted that history says quite the opposite happens. Typically, when the Fed PAUSES after a series of rate hikes, there is a brief uptick in the markets.  But what the red arrows on the chart below shows, it is when the Fed starts to CUT rates, that the big losses occur.

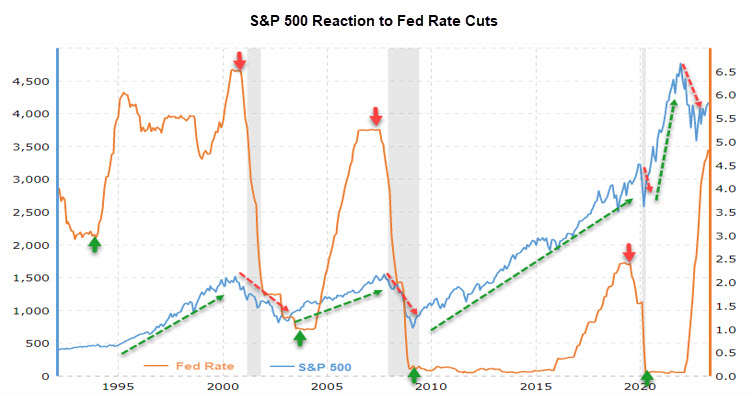
This makes sense, as the reason the Fed starts cutting rates is the economy is in trouble and likely headed for a recession, so investors dump stocks because stocks DO NOT do well in a recession. What the chart shows is the markets typically fall as rates are cut and not until the FED STOPS CUTTING (green arrows) do stocks start to rise again.

Currencies:

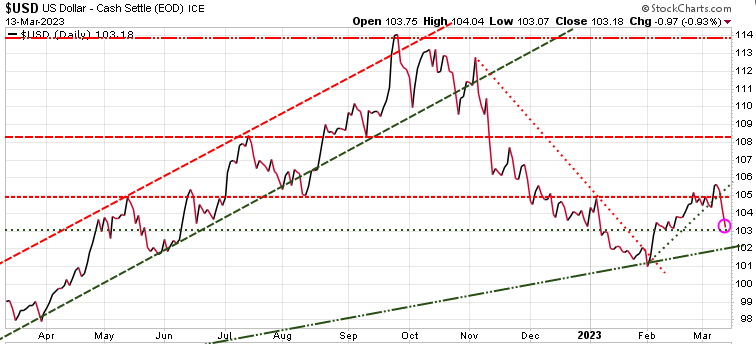
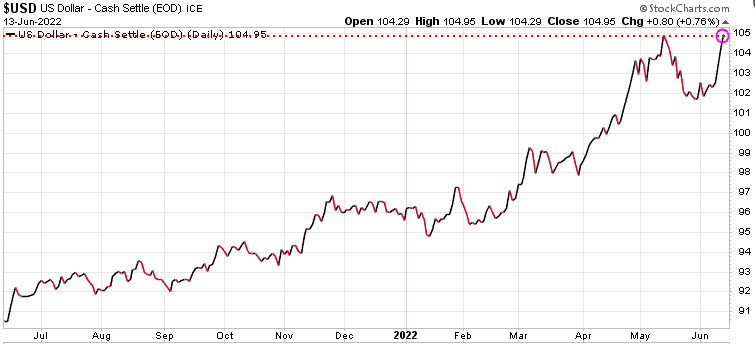
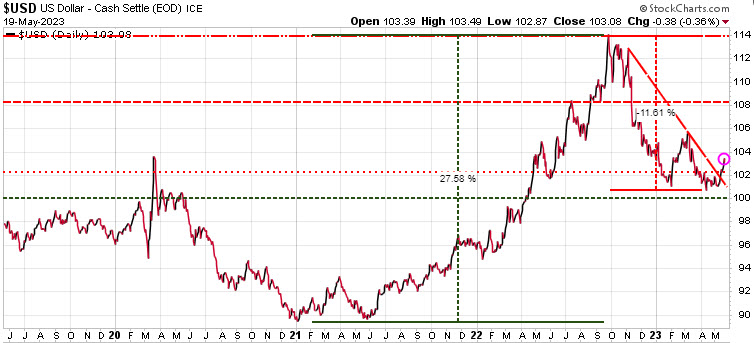
The $US was very strong from early 2021, when the Fed started aggressively raising rates till Sept 2022, and over that 22 month period the $US jumped over 27%.

Back in October, we called for a top in the $US and since then it has fallen almost 12%. But in the last 7 weeks, the $US has been forming a base formation and in the last 2 weeks has been rising, having now broken above that downtrend line from last fall (red diagonal line), and  also breaking above the tight trading range it has been in since mid March.


Why is this happening? One thought we have is that for most of the past decade the mantra on Wall Street has been ‘Don’t Fight The Fed.’  But ever since the Fed started to raise interest rates, the markets HAVE been fighting the Fed, not believing they would continue to raise rates. For most of the past year, the Fed, Bank of Canada and the ECB have all stated that they will keep rates high until inflation is near 2%. Today, inflation in the US is 4.9%, in Canada it is 4.4%, and in most of Europe it is over 7%. That suggest these central banks DO NOT want to cut rates, but at some point they will likely have to, due to some serious hit to the economy.

For now, the $US is looking like it is getting its legs.

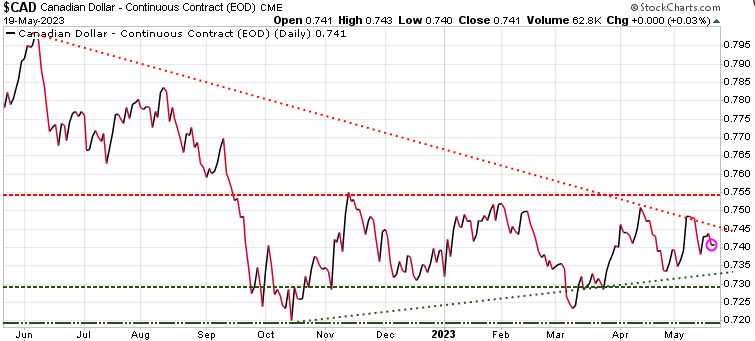
For the $CAD, just like most every other currency, it trades inverse to the $US. The $CAD has been trading in a tight range between 72.5 and 75.50.  The $CAD is also forming a wedge pattern where it will soon break out either up or down.

Gold:

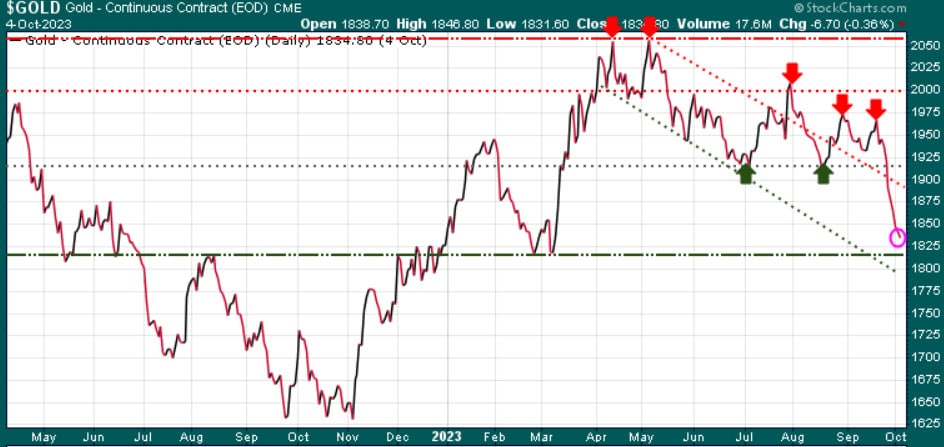
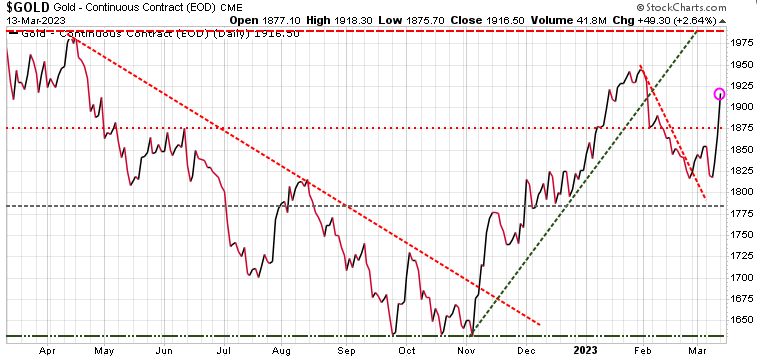
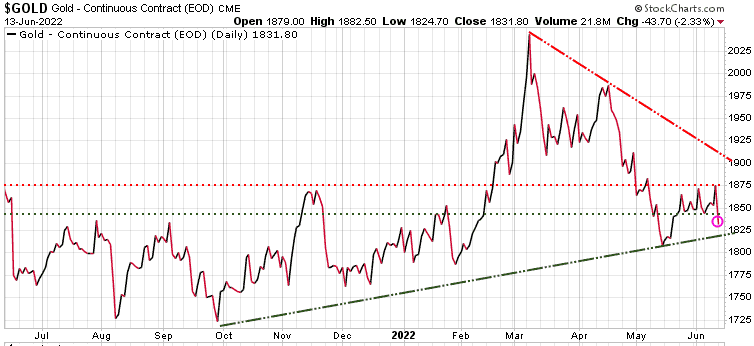
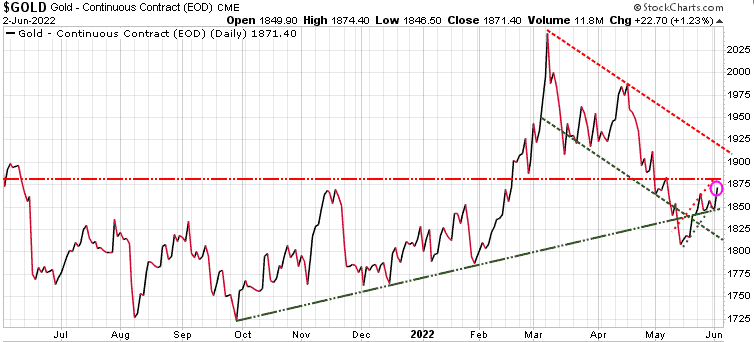
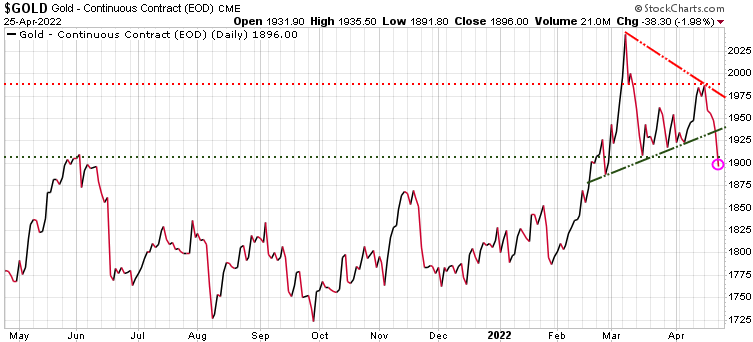
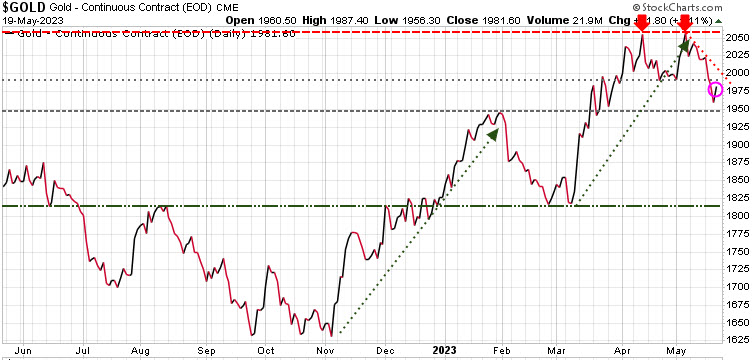
Gold  and silver have had a terrific couple of runs recently; from November to late January, then another from early March to early May (green diagonal arrows).

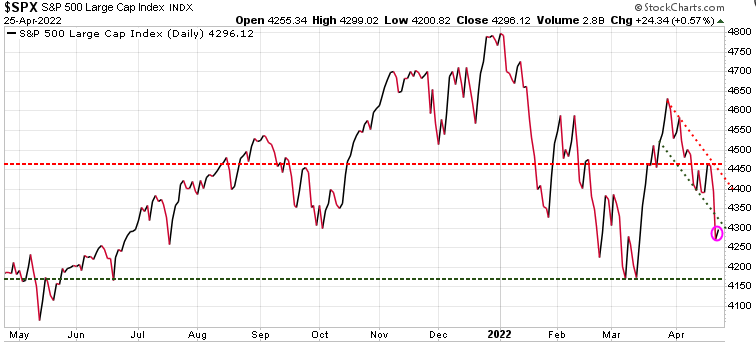
Gold has twice tested key resistance at 2060 (red arrows) and even spiked intra-day to 2083 about a couple of weeks ago. But since then, we have seen gold and silver decline, with gold down ~$140 from that intra-day high of 2083. On Thursday, gold hit our target low at 1950 and has bounced Friday with debt ceiling talks breaking down.

Silver was down over 10% in a little over 2 weeks before Friday’s bounce. In BULL markets silver outperforms gold and in BEAR markets silver underperforms gold.

One thing that we have been watching is that the mining stocks have been lagging the metals – something we are keeping an eye on


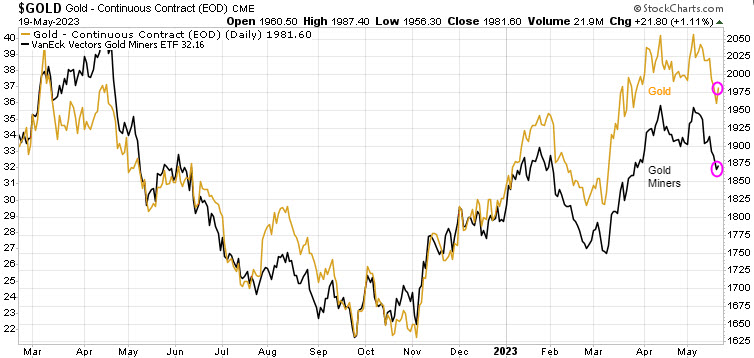
We are in a pullback here, which gold and  silver needed, so that’s healthy. We think gold and silver will continue to outperform the S&P 500 for the next few years. One of the big drivers for gold will be the loss of confidence investors have in government. Once that confidence is broken, we expect gold to rise along with the $US as safe-haven plays.

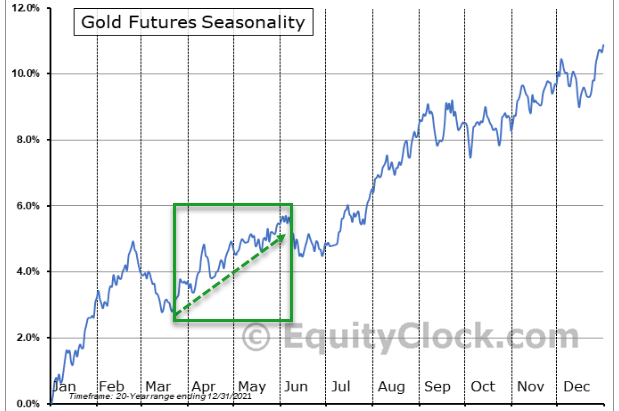
Based on seasonality, gold and silver typically have a great run starting from July till September.

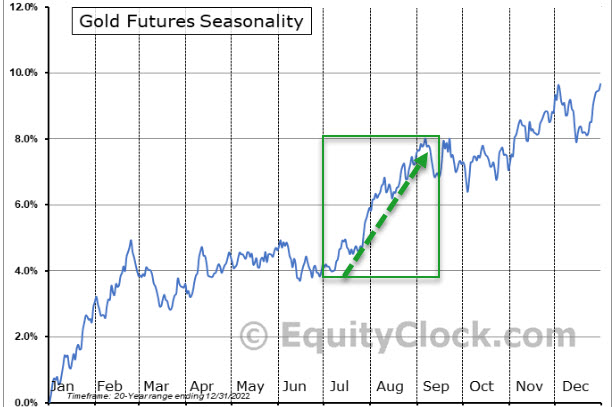
We suggest buying the dips.

Stay tuned!

Special Offers

Trend Letter:
Since start-up in 2002 Trend Letter has provided investors with a great track record, giving exceptionally accurate information about where the markets are going, and it has explained in clear, concise language the reasons why. Using unique and comprehensive tools, Trend Letter gives investors a true edge in understanding current market conditions and shows investors how to generate and retain wealth in today’s climate of extreme market volatility.

A weekly publication covering global bonds, currencies, equities, commodities, & precious metals. Publishes every Sunday evening, covers equites, currencies, precious metals, commodities, and bonds. Each weekly issue is about 50 pages, mostly charts, with key bullet points to make easy to understand. A 10-15 min read

Timer Digest says“Trend Letter has been a Timer Digest top performer in our Bond and Gold categories, along with competitive performance for the intermediate-term Stock category.”


Technical Trader:
Trend Technical Trader (TTT) is a premier hedging service, designed to profit in both up and down markets.

Our hedging strategy empowered  TTT subscribers to not only protect wealth from serious losses during markets crashes, it allowed them to be positioned to make significant gains as markets crashed.

TTT isn’t just a hedging service.  Its timing strategies have returned fantastic gains on the long side. See examples here

Included is our proprietary Gold Technical Indicator (GTI).


Trend Disruptors:
Disruptive technology trends will propel our future and the reality is that no industry will go untouched by this digital transformation. At the root of this transformation is the blurring of boundaries between the physical and virtual worlds. As digital business integrates these worlds through emerging and strategic technologies, entirely new business models are created.

Trend Disruptors is a service for investors seeking to invest in advanced, often unproven technology stocks on the cheap, with the objective to sell them when masses finally catch on. Covering Artificial Intelligence (AI), Virtual Reality (VR), Augmented Reality (AR), 5G, Quantum Computing & many more.

All subscriptions in $US

Special Offers

ServiceRegular PriceSpecial PriceSavingSubscribe
Trend Letter$599.95$349.95$250Trend Letter $349.95
Technical Trader$649.95$349.95$300 Trend Technical Trader $349.95
Trend Disruptors$599.95$349.95$250 Trend Disruptors $349.95
Better Deals
Trend Letter + Technical Trader$1,249.90$549.95$699.95 Trend Letter & Technical Trader $549.95
Trend Letter + Trend Disruptors$1,199.90$549.95$649.95 Trend Letter & Trend Disruptors $549.95
Technical Trader + Trend Disruptors$1,249.90$549.95$699.95 Technical Trader & Trend Disruptors $549.95
Best Deal
Trend Suite: Trend Letter + Technical Trader + Trend Disruptors$1,849.85$649.95$1,199.90 Trend Suite: TL + TTT + TD $649.95


Market Notes

Market Notes – March 13/23

US stocks finished Monday mixed as volatile trading gripped Wall Street after federal banking regulators took aggressive actions to stem the fallout of Silicon Valley Bank’s failure.

First Republic Bank led a decline in bank shares Monday that came even after regulators’ extraordinary actions Sunday evening to backstop all depositors in failed Silicon Valley Bank and Signature Bank and offer additional funding to other troubled institutions. First Republic is now down ~80% since February 2/23.

Many of the bank stocks were halted repeatedly for volatility throughout the day.

With fear of a banking crisis, bonds spiked as investors ran to safety.

With the collapse of these banks, the market is now changing its tune on Fed rate hikes.

The $US was down with expectations that the Fed will slow their rate hike efforts. We will see.

Gold spiked higher as a safe-haven play.

Oil continued its decline. Could be seeing a great buying opportunity soon.

US CPI data is out  tomorrow.

Stay tuned!

Market Notes

Market Notes – June 13/22

The S&P 500 dropped back into a bear market within the first 30 minutes of trading today. The index is now down over 20% from its January high, marking the lowest level since March 2021. The Dow plummeted 2.79% while the Nasdaq fell 4.8%. Recession fears are growing amid crippling inflation and people are pulling out of their positions before the situation worsens.

For the last six months we have warned that in bear markets, relief rallies typical fail to make new highs and in fact tend to make new lows.  Our Trend Letter and especially our Trend Technical Trader (TTT) services have been using hedging strategies to protect our portfolios from these violent bear markets and even to profit from them.

Bear markets typically have three phases. The first stage is a sharp decline, followed by a rebound, and then a drawn-out fundamental downtrend. This is likely where we are now and we are likely to see some strong relief rallies, followed by deep corrections.

If you have yet to put any hedging strategies in place, we should be due for a rally very soon, which would be an opportunity to put in such a strategy.  If you need assistance on how to hedge, seriously think about subscribing to TTT at a 50% discount. Click here to subscribe.

The Nasdaq representing the tech stocks is now down over 32% since its high in November.

The S&P 500 is now officially in a bear market, having dropped over 21% since its high at the start of January.

The Canadian TSX has fared much better thanks to energy sector. The TSX is down ~10% and has not yet hit new lows.

Volatility spiked over 22% today.

The $US continues to be a safe-haven play in this bear market, testing recent high.

On Friday Gold jumped along with the $US as a safe-haven play. Today it fell off – very inconsistent and frustrating!

Stay tuned!


Market Notes

Market Notes – June 2/22

A major reason the equity markets had such a great run over the past decade has been thanks to the loose monetary policy of the Federal Reserve. And from August 2019, the Fed has increased its balance sheet 137%, from $3.76 trillion, to $8.92 trillion. That is more than all of the prior QE periods combined.

Now the Fed is starting to shrink its balance sheet , starting a new era of Quantitative Tightening (QT). The last time we saw QT was in 2018 where the Fed shrunk its balance sheet by almost $700 billion in 15 months. The result of that QT was the equity markets declined, then the Fed quickly backed off, reversing its stance, lowering interest rates and starting a new QE program that massively added to the balance sheet.

While QE has dramatically juiced the stock markets over the past decade, QT will have the opposite effect. While many are saying that the bottom is in for the equity markets, as long as the Fed sticks to their QT plan, we suggest there is more pain to come.

The US 10-Year yield had been making lower highs for nearly a month, but recently has started moving higher again. For those who don’t watch bonds and yields closely, bonds and yields move opposite each other. We want to keep  an eye on this as if the yields start to decline again it means that bonds are rising, and bonds are typically safe-haven plays, suggesting the bond market is bearish on the equity markets.

After sinking below $1,800 in May, gold has spent the last few weeks rising to ~$1,870. And a breakout north of $1,880 would likely compound into additional gains. While we could get a nice run here, we expect the next big rally for gold will likely start in the fall.

Stay tuned!

Market Notes

Market Notes – April 25/22

(AP News)…Elon Musk reached an agreement to buy Twitter for roughly $44 billion on Monday, promising a more lenient touch to policing content on the social media platform where he — the world’s richest person — promotes his interests, attacks critics and opines on a wide range of issues to more than 83 million followers.

The outspoken Tesla CEO has said he wanted to own and privatize Twitter because he thinks it’s not living up to its potential as a platform for free speech.

Musk said in a joint statement with Twitter that he wants to make the service “better than ever” with new features, such as getting rid of automated “spam″ accounts and making its algorithms open to the public to increase trust.

“Free speech is the bedrock of a functioning democracy, and Twitter is the digital town square where matters vital to the future of humanity are debated,” the 50-year-old Musk said, adding hearts, stars and rocket emojis in a tweet that highlighted the statement.

Musk’s offer is $54.20 for each share.

Wild swings for the equity markets today, with the S&P 500 tumbling at the opening where it bottomed at 4200, and then fought its way to a high of 4299, before closing near that high at 4296. In yesterdays’ issue of the Trend Letter, we told subscribers… ‘sentiment is very bearish, which to us can be quite contrarian, suggesting a possible relief rally, short-term is likely.’ 

Watch the 4470 level for near-term resistance, and 4600 for key resistance. Understand that with the Fed tightening its balance sheet, raising rates, and  the yield curve inverting, a recession is extremely likely.  The first step is for the S&P 500 to break out of its downtrend channel.

Gold had another disappointing day, closing down 38.38 on Monday. Gold has now lost 108.00 since the intra-day high last Monday.

Based on seasonality, gold is in a strong period from late March through to early June. So far, that strong historic trend has not materialized this year.

Stay tuned!