As an investor, you never want to put all your investment eggs in one basket. In addition to investing in stocks, bonds, currencies, precious metals,  investing in commodities can provide yet another avenue to diversify one’s portfolio. Unfortunately, many investors overlook the opportunities available to them in commodities. There are several ways to invest in commodities, which are raw materials that are either used directly, such as food, or indirectly to produce another product.

If we look at the recent situation where the Covid lockdowns forced oil prices down to below $0 for a brief period of time. Savvy investors at the time took advantage of those once inn a lifetime global crisis to invest in oil and reaped massive gains as the global economy started to recover and the price of oil went from $0 to over $100.

You can invest in commodities in several different ways including by purchasing physical goods, such as gold, or by purchasing ETFs that track specific commodity indexes. You can also buy stocks of commodity-related businesses such as oil and gas producers or miners of base metals such as copper, zinc, nickel, ore, etc..

Some  of the most traded commodities are:

  • Oil
  • Natural gas
  • Metals
  • Corn
  • Wheat
  • Soybeans
  • Cattle
  • Hogs
  • Lumber

Commodity industries are all about supply and demand. In any individual commodity industry, the product is largely the same. Wheat is wheat, cattle are cattle. Because of this, producers are all price-takers and in normal times are not able to dictate prices. Many commodity industries are prime examples of what’s called perfectly competitive industries, with many buyers demanding an undifferentiated product and suppliers unable to offer differentiated products.

Here are some keys to think about when considering investing in commodities:

  • Investing in commodities can provide investors with diversification, a hedge against inflation, and excess positive returns.
  • Investors may experience volatility when their investments track a single commodity or one sector of the economy.
  • Supply, demand, and geopolitics all affect commodity prices.
  • Investors can trade commodity-based futures, stocks, ETFs, or mutual funds, or they can hold physical commodities such as gold bullion.

For all the latest blog articles click here

“Fueling Success: Exploring Explosive Investment Opportunities in Energy”

Martin re-recorded his presentation from the World Outlook Financial Conference in Vancouver on February 2/3, 2024. In the presentation he outlines key energy sources and gives 12 stocks for investors to consider in the natural gas, uranium, and oil sectors.

Market Notes – September 1/23

Some investment news for those looking to invest in gold, invest in stocks, or currencies, and commodities.

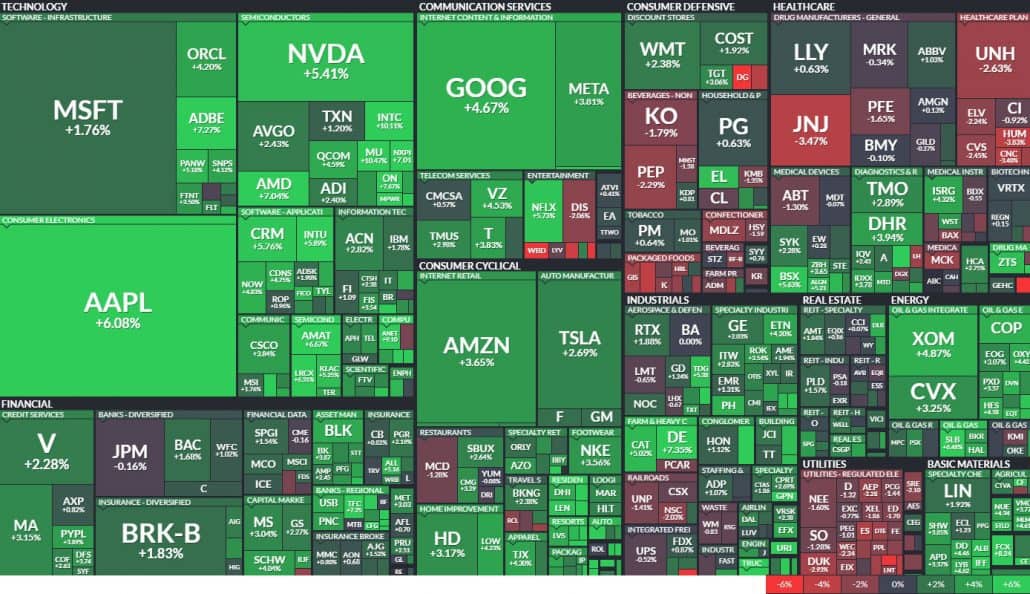
Each week the Trend Letter, displays weekly heat map of the S&P 500. It is a great visual of the equity market that holds stocks many North Americans own. Each of the 500 stocks is shown in a box, & the size of the box represents its market valuation, and the colour of each box tells you how that stock did, GREENS being gains & REDS being losses.

As we can see, for the week, big tech stocks led the way higher. There was also a lot of green throughout most other  sectors, with utilities and healthcare being the main exceptions.

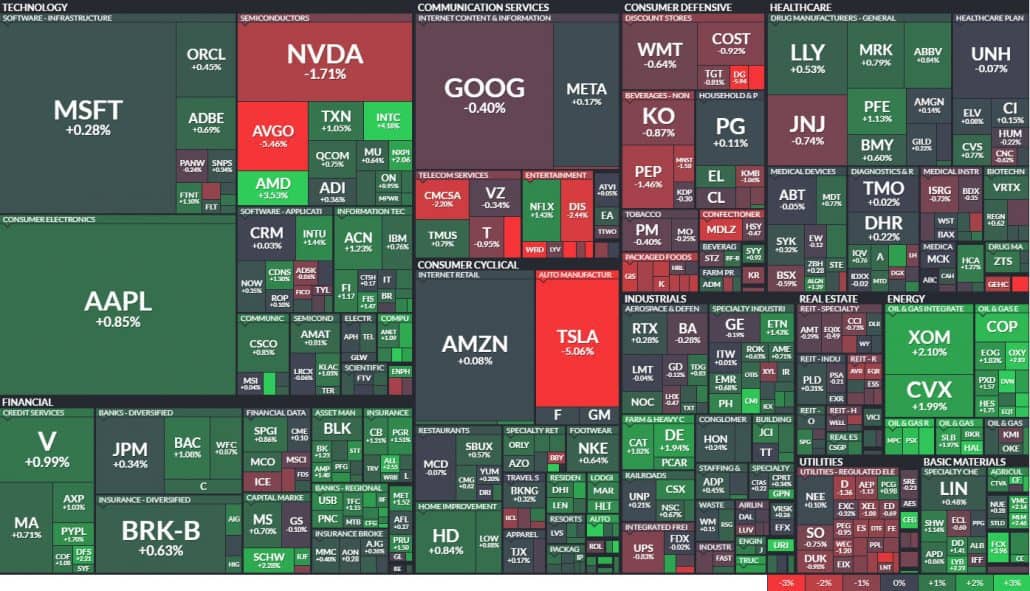
On the daily heatmap a bit of a different story, with some big tech in red.

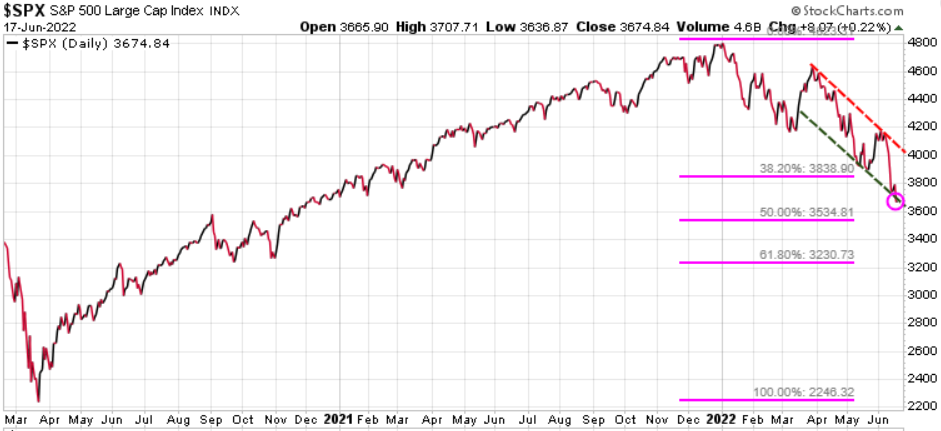
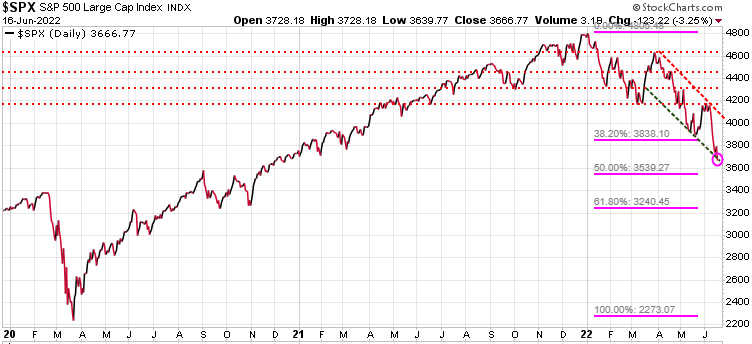
Looking at the BIG picture, the S&P 500 is still solidly in a long-term uptrend channel, since 2009. If we were to test the initial support level  of that long-term uptrend channel, we would see a correction to the 4000 level, which would be a ~11% decline  from the current 4500 range

Based on seasonality, September is the weakest month for the S&P 500.

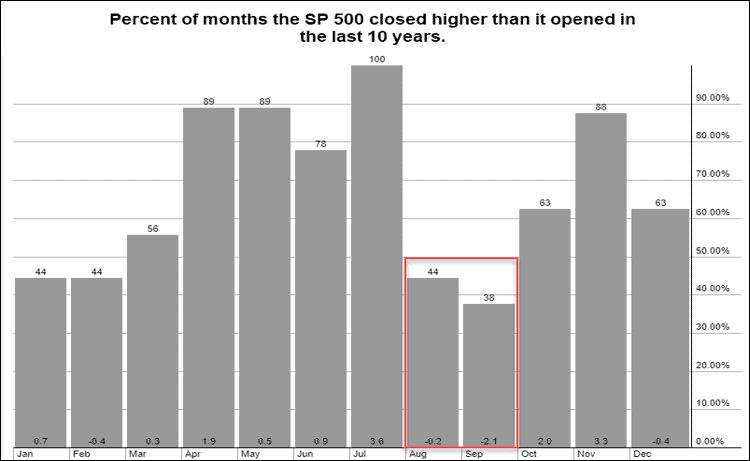
If we do get a decent correction in September, it could provide a good buying opportunity. Sectors that have looked good are oil, uranium, tech, gold, base materials and even cannibals cannabis, what with US health dept urging the DEA to relax restrictions. We will see if these will remain strong after Labour Day, or if the negative September seasonals take over.

What we do at Trend Letter is track those key support & resistance levels, looking for changes in trend, and then and alert subscribers when trends change.

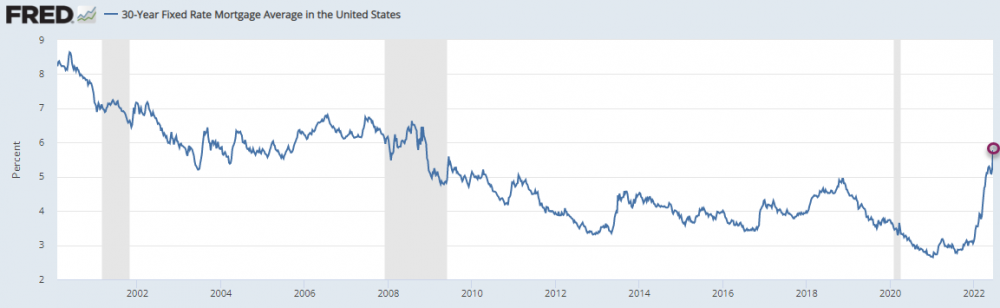
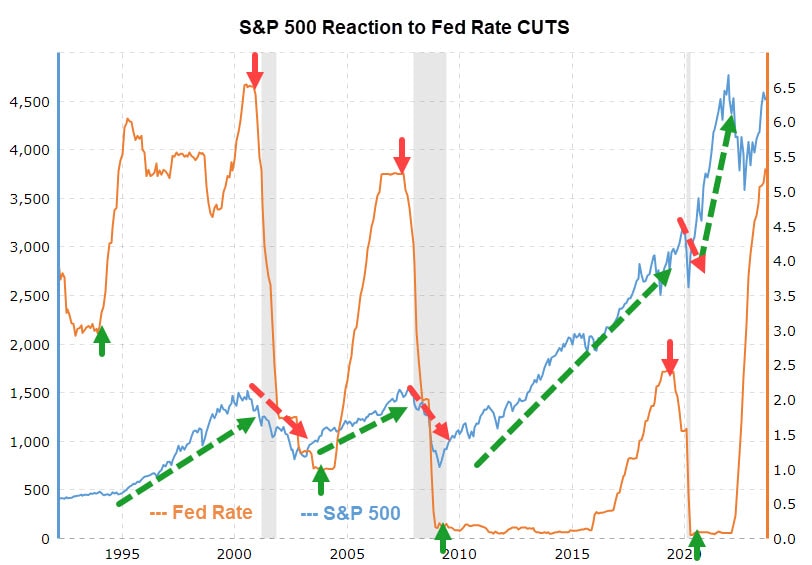
In Martin’s interview with Jim Goddard on This Week in Money on Friday (interview start at 44:39), he promised to show the chart below. If we look at the last number of times the Fed CUT rates recently, so 2000, 2007 and 2020…each time was driven by the economy falling into a recession (grey shaded bars). And when they CUT rates (red arrows) the S&P 500 had sharp declines. In each of those CUTTING phases it was not until the Fed STOPPED cutting rates that the S&P 500 started to recover (green arrows).

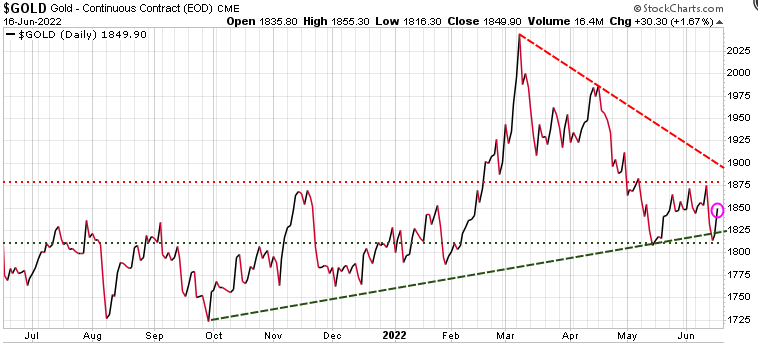
For those investing in gold, the key numbers are::

  • Near-term resistance is 2000, 2040, then 2070, which was that double top in April-May
  • Next key support level is 1915, 1900, 1880, then & really strong support at 1825
  • If it does drop to 1825, that would likely trigger several new BUY alerts

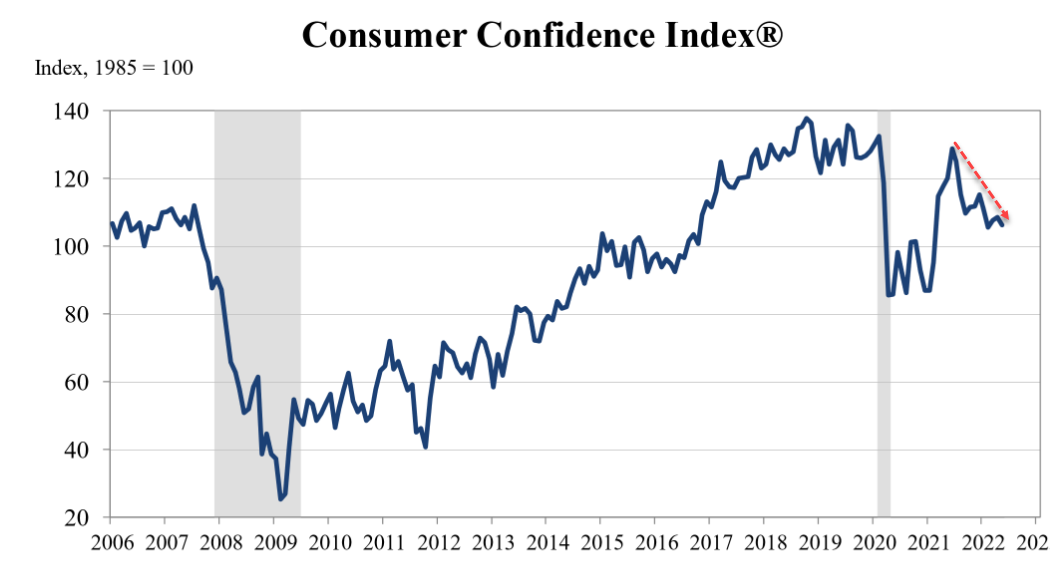
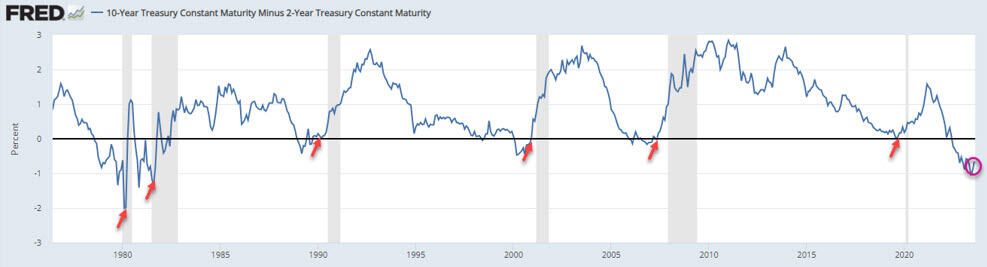
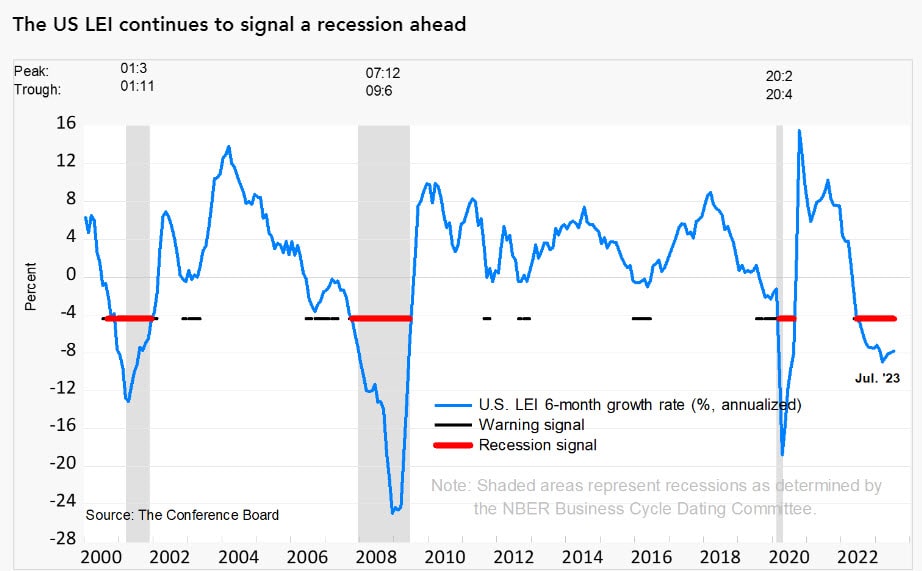
In Martin’s interview with Jim Goddard, he explained why he still feels a recession is very possible. He outlined the two key leading indicators, the inverted yield curve and the Conference Board’s Leading Economic Index (LEI).  Both of these have an almost perfect record in forecasting recessions. Both are forecasting a recession coming soon.

A yield curve is inverted when short-term yields are higher than long-term yields. An inverted yield curve is a leading indicator of a recession and since 1955 (68 years), there has been only one time where the yield curve inverted without there being a recession.Recently, the yield curve is the most inverted it has been in over 40 years. Recessions don’t start when the yield curve inverts, but rather when it starts to ‘uninvert’ (red arrows).

This chart clearly shows that for each of the last 6 recessions, they all started after the yield started to rise. Today, the yield curve is starting to ’uninvert’ (circle).

The other indicator with a near perfect record of forecasting a recession is the Conference Board’s Leading Economic Index, which looks at 10 components across the US economy. That index, again in its latest report last week, is firmly saying a recession is coming.


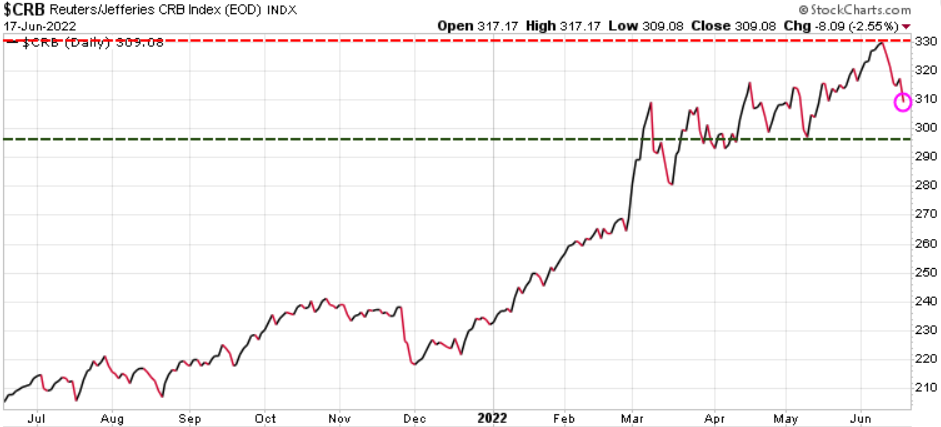
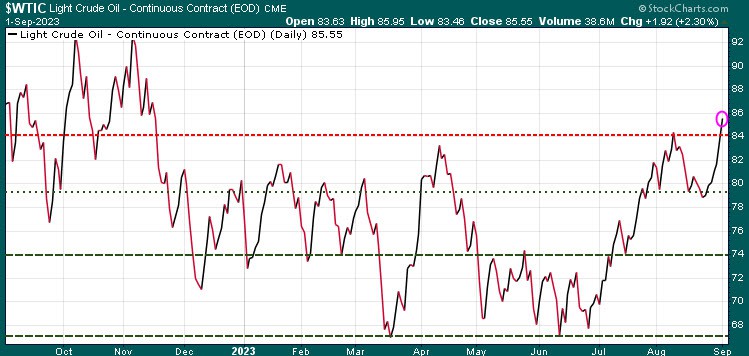
Oil has had a great week after dropping down to the 80.00 level, it has rallied big time this week, and closed Friday at 85.55.  The big bump this week came after a massive 11.5 million barrel drawdown in US crude inventories. Also, we have the Saudi Arabia production falling and they, plus potentially Russia, are expected to extend the production cuts into the end of October.

Stay tuned!

We are offering discounted prices for our three services and with each new subscription this week, we will donate $100 to Special Olympics.  See Special Offers below.

 Trend Letter:
Since start-up in 2002 Trend Letter has provided investors with a great track record, giving exceptionally accurate information about where the markets are going, and it has explained in clear, concise language the reasons why. Using unique and comprehensive tools, Trend Letter gives investors a true edge in understanding current market conditions and shows investors how to generate and retain wealth in today’s climate of extreme market volatility.

A weekly publication covering global bonds, currencies, equities, commodities, & precious metals. Publishes every Sunday evening, covers equites, currencies, precious metals, commodities, and bonds. Each weekly issue is about 50 pages, mostly charts, with key bullet points to make easy to understand. A 10-15 min read

Timer Digest says“Trend Letter has been a Timer Digest top performer in our Bond and Gold categories, along with competitive performance for the intermediate-term Stock category.”


Technical Trader:
Trend Technical Trader (TTT) is a premier hedging service, designed to profit in both up and down markets.

Our hedging strategy empowered  TTT subscribers to not only protect wealth from serious losses during markets crashes, it allowed them to be positioned to make significant gains as markets crashed.

TTT isn’t just a hedging service.  Its timing strategies have returned fantastic gains on the long side. See examples here

Included is our proprietary Gold Technical Indicator (GTI).


Trend Disruptors:
Disruptive technology trends will propel our future and the reality is that no industry will go untouched by this digital transformation. At the root of this transformation is the blurring of boundaries between the physical and virtual worlds. As digital business integrates these worlds through emerging and strategic technologies, entirely new business models are created.

Trend Disruptors is a service for investors seeking to invest in advanced, often unproven technology stocks on the cheap, with the objective to sell them when masses finally catch on. Covering Artificial Intelligence (AI), Virtual Reality (VR), Augmented Reality (AR), 5G, Quantum Computing & many more.

All subscriptions in $US

Special Offers

ServiceRegular PriceSpecial PriceSavingSubscribe
Trend Letter$599.95$349.95$250Trend Letter $349.95
Technical Trader$649.95$349.95$300 Trend Technical Trader $349.95
Trend Disruptors$599.95$349.95$250 Trend Disruptors $349.95
Better Deals
Trend Letter + Technical Trader$1,249.90$549.95$699.95 Trend Letter & Technical Trader $549.95
Trend Letter + Trend Disruptors$1,199.90$549.95$649.95 Trend Letter & Trend Disruptors $549.95
Technical Trader + Trend Disruptors$1,249.90$549.95$699.95 Technical Trader & Trend Disruptors $549.95
Best Deal
Trend Suite: Trend Letter + Technical Trader + Trend Disruptors$1,849.85$649.95$1,199.90 Trend Suite: TL + TTT + TD $649.95
Market Notes

Market Notes – June 17/22

For those wanting to jump in and ‘buy the dip’ be mindful of our constant warnings that ‘bear market rallies typically fail to make new highs, and instead often make new lows.’

According to Bank of America ‘The average peak to trough bear decline = 37.3%, average duration 289 days; history is no guide to future performance but if it were, today’s bear market would end on Oct 19, 2022 (35-year anniversary of Black Monday) with S&P 500 at 3000.

The S&P 500 has dropped through the 38% fibonacci retracement level at 3838 and is approaching the 50% retracement at 3534.

A few months ago we targeted mid-year as a potential top for commodities. We are seeing food, lumber, even gasoline and oil coming down this week. Could the top be in?

Here is the Reuter CRB Commodity Index and it has started to roll over. Watch the 296 level (green horizontal line), which was the May low; a break below that level would be bearish. Understand that long-term we are very bullish commodities, but if we are heading for a recession then commodities will be hit as well. Once the bottom is in, we will be sending out BUY signals to subscribers.

Michael Hartnett of Bank of America notes that Fed tightening ‘always breaks something’ with the US recession likely the last leg lower in this bear market. Looking at the their Bull & Bear indicator we can see that it has dropped right down to zero, which is quite extreme. This is a contrarian indicator suggesting one of those bear markets rallies should kick off next week.

Another sign a recession likely coming as manufacturing took a big hit last month.

And yet another negative piece of news. ‘Global profit expectations among money managers are tumbling, another sign that Wall Street is at a crisis point’, according to BofA Securities. In their June Fund Manager Survey of 800 panelists with $834B under management, a net 72% say corporate profits will worsen, the lowest reading since the collapse of Lehman Bros. in September 2008.

There is a term called the ‘wealth effect.’ It refers to how homeowners and investors feel when housing prices and the value of their stock portfolios go up in value; they feel wealthy and therefore are willing to spend more. Consumers account for ~70% of the GDP, so when they spend more, it is good for the economy. Of course the reverse is also true, when house prices and stocks fall in value, consumers spend less and the economy slows.

Various indicators continue to portray extreme bearishness, which in a bull market would be a solid BUY signal. But, this is not a bull market, so we need to show caution here. If you have not yet put on any hedge positions, use this next relief rally to do so. Trend Technical Trader (TTT) uses simple inverse ETFs for hedging and offers subscribers many options; there is something for every investor. Click here to subscribe to TTT at a 50% discount

Market Notes

Market Notes – June 16/22

The S&P 500 dropped 123 points or 3.25% and is now close to testng the 50% Fibonacci retracement level from the rally from Mar’20 to Jan’22.  Remember our warning all through this year… bear market rallies tend to be sucker rallies, usually failing to reach new highs, and instead make new lows. We are neutral right now, with our insurance trade offsetting our long play.

We do have a great list of stocks on our watch list, but we are NOT buying the dip here. We will let our subscribers know when our models trigger a BUY Signal. If you want receive those BUY Signals when they are triggered, subscribe now to the Trend Letter and receive 50% off the regular rate. Click here to take advantage of this  special offer.

Yesterday Fed chair Jerome Powell stated ‘Overall, spending is very strong, the consumer’s in really good shape financially — they’re spending. There’s no sign of a broader slowdown that I can see in the economy.’ That is quite an astonishing statement and we have no idea what data he is looking at. Every consumer sentiment chart we see shows consumers are anything but confident.

Even the Atlanta Fed, Powell’s own institution, is now forecasting Q2 GDP to come in precisely at 0.0%. That’s down from a 2% forecast in May and then a 1% forecast earlier this month. Given that the consumer accounts for~70% of the economy, how can he possibly say the consumer is in ‘really good shape financially’

Inflation was caused by excess government spending, a very dovish Fed, and high energy prices caused by the Ukraine war and extremely nearsighted energy policies.. The way the Fed seems to be planning to stop inflation is to drive the economy into a recession. And then once the recession takes hold, those laid off workers will not be able to afford things like gasoline or healthy food, so the prices will finally start to fall.

Gold had been oversold and had a nice bounce today. Still trading in 1800-1975 range.

Mortgage rates for the US 30-year jumped by the most since 1987 and are now at the highest level since 2008, which coincided with the real estate crash and a recession. Sound familiar?

Stay tuned!