
The big question now is, have we seen the bottom of this bear market? Could be, but we doubt it. Here is a chart that we have shown our subscribers a few times over the last couple of months. It shows the 4 phases of a bear market:
- Stealth – where the Smart Money enters the market
- Awareness – sees Large Speculators enter the market
- Mania – this is where the retail or what we like to call the Masses buy in
- Blow-off – Where the market starts to turn down
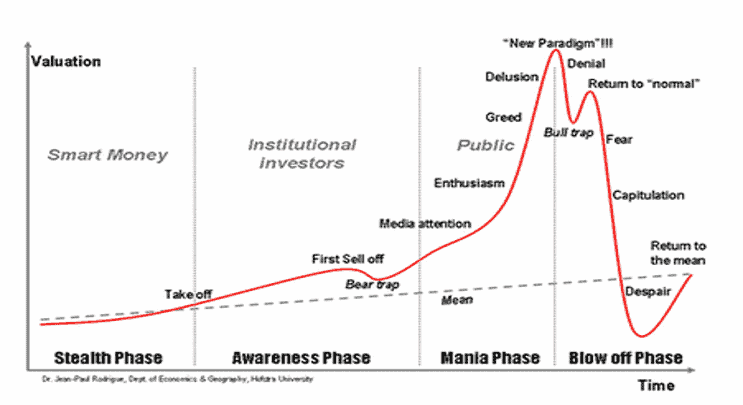
At the top of the mania phase, everyone wants in, even those who haven’t ever followed the stock market…FOMO – Fear Of Missing Out. The 2021 REDDIT crowd pushing up ‘meme’ stocks like GameStop and AMC was a classic example of a Mania Phase top.
The Blow-off phase is where we get investors fall into denial, hoping the market rallies back to the highs, but it just keeps going lower. Then capitulation kicks in and ultimately, we get despair at ‘the bottom.’
When we look at those phases and overlay the current S&P 500 chart, it suggests we are the Blow-Off phase.
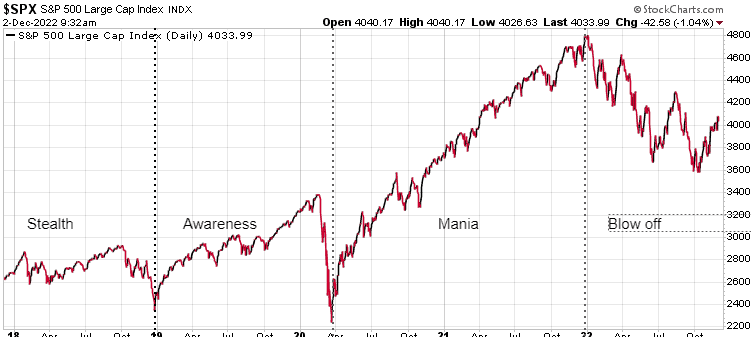
This would tell us that any rally here would be another short-term relief rally, maybe a few weeks, even a month.
We still need to see ‘capitulation’ and ultimately ‘despair’ kick in to finally hit the bottom
So based on all that, we would suggest we are still in a bear market. Now that doesn’t mean we can’t have a solid rally through year-end, but until we hit that capitulation and despair, we are not likely to hit bottom just yet.
Here is another chart we keep showing subscribers to remind them how volatile bear markets can be. It shows how from early 2000 to late 2002 the Nasdaq had 8 significant rallies all over 16%, with some over 40%, but still, over that period the Nasdaq lost 75% of its value.
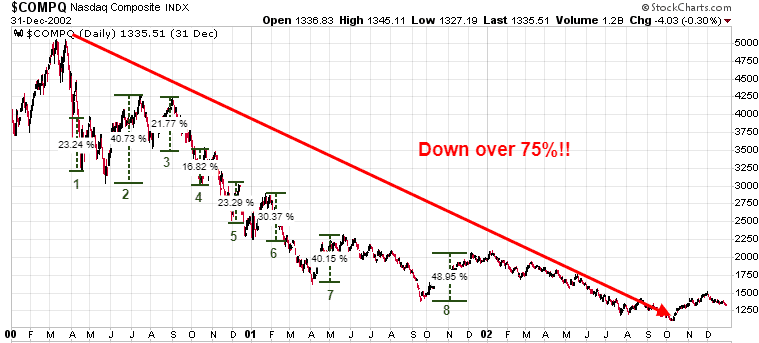
So, while we could certainly see a strong rally here, be aware of how bear markets usually end in capitulation and despair.
To understand how to navigate these very volatile markets, seriously consider subscribing to our Trend Letter & Trend Technical Trader services.
Trend Letter:
Since start-up in 2002 Trend Letter has provided investors with a great track record, giving exceptionally accurate information about where the markets are going, and it has explained in clear, concise language the reasons why. Using unique and comprehensive tools, Trend Letter gives investors a true edge in understanding current market conditions and shows investors how to generate and retain wealth in today’s climate of extreme market volatility.
A weekly publication covering global bonds, currencies, equities, commodities, & precious metals. Over the 20 years Trend Letter has been published, it has achieved an incredible average return of 65% on its closed trades.
Timer Digest says: “Trend Letter has been a Timer Digest top performer in our Bond and Gold categories, along with competitive performance for the intermediate-term Stock category.”
Technical Trader:
Trend Technical Trader (TTT) is a premier trading and hedging service, designed to profit in both up and down markets. Included is our proprietary Gold Technical Indicator (GTI).
TTT had another excellent year in 2020 averaging +27.3% per closed trade with an average holding time of 9.5 weeks, or +149% annualized overall.
Over the past 5 years TTT’s closed trades have averaged +40% annualized.
Special Offers
| Service | Regular Price | Special Price | Saving | Subscribe |
|---|---|---|---|---|
| Trend Letter | $599.95 | $349.95 | $250 | Trend Letter $349.95 |
| Technical Trader | $649.95 | $349.95 | $300 | Trend Technical Trader $349.95 |
| Trend Disruptors | $599.95 | $349.95 | $250 | Trend Disruptors $349.95 |
| Better Deals | ||||
| Trend Letter + Technical Trader | $1,249.90 | $549.95 | $699.95 | Trend Letter & Technical Trader $549.95 |
| Trend Letter + Trend Disruptors | $1,199.90 | $549.95 | $649.95 | Trend Letter & Trend Disruptors $549.95 |
| Technical Trader + Trend Disruptors | $1,249.90 | $549.95 | $699.95 | Technical Trader & Trend Disruptors $549.95 |
| Best Deal | ||||
| Trend Suite: Trend Letter + Technical Trader + Trend Disruptors | $1,849.85 | $649.95 | $1,199.90 | Trend Suite: TL + TTT + TD $649.95 |