Investing in stocks is a way to set aside money while you are busy with life and have that money work for you so that you can fully reap the rewards of your labor in the future. Legendary investor Warren Buffett defines investing as “the process of laying out money now in the expectation of receiving more money in the future.” The goal of investing is to put your money to work in one or more types of investment vehicles in the hopes of growing your money over time.

The key is that you don’t need to be an expert to invest like one. What you need is a good source that explains what is happening in the markets and then makes recommendations, telling you WHY you should invest in that stock or sector.

Since 2002 the Trend Letter has delivered average returns of over 40% per closed trade. We help people just like you understand what is happening in the markets and what sectors, and stocks make the most sense to invest in.

What Are the Risks of Investing?

Investing is a commitment of resources now toward a future financial goal. There are many levels of risk, with certain asset classes and investment products inherently much riskier than others. However, essentially all investing comes with at least some degree of risk: it is always possible that the value of your investment will not increase over time. For this reason, a key consideration for investors is how to manage their risk to achieve their financial goals, whether they are short- or long-term.

Key rule: Have an Exit Strategy

The first rule in being a successful investor is to not lose money. That might sound obvious, but the truth is most investors have no exit strategy for when they are wrong.  Basic human emotion is perhaps the greatest enemy of successful investing. But whether you’re a long-term investor or a day trader, a disciplined approach to trading is key to profits. You must have a trading plan with every trade. You must know exactly at what level you are a seller of your stock—on the upside and the down. Before we buy any stock or Exchange Traded Fund (ETF) we always set a SELL Stop in case the market moves against us.  When the stock starts rising, we raise our SELL Stop to ensure we lock in gains when we get a pull back.

The bottom line

Being a successful invest requires having the tools necessary that give you the best information to understand current and future market trends. At Trend News we offer three services for investors:

  1. Trend Letter is a weekly service that covers stocks, bonds, currencies, commodities, and precious metals. Trend letter has been publishing since 2002 and has an incredibly successful record over that 20+ year span.
  2. Trend Technical Trader (TTT) is an online service that was originally designed as a hedging service, allowing investors to protect their investment during down markets.  We have expanded TTT service to include trading long positions in precious metals, commodities, and other sectors as well.
  3. Trend Disruptors is our service for investors interested in investing in technical sectors. Disruptive technology propels us into the future at a rapid and increasing pace. Virtually no industry goes untouched, as the boundaries between the physical and virtual worlds are erased, transformed, or re-imagined. New technology can re-shape existing business around the world, and create entirely new business models never before thought of.

Whatever you  experience, we have a service that can help you become a very successful investor. It’s your money – take control.

Market Notes

Navigating market crossroads

As an investment newsletter we strive to keep investors on top of what is driving the markets.

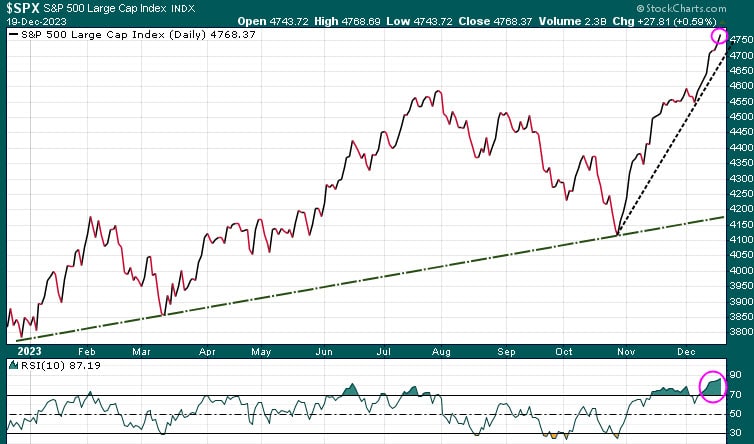
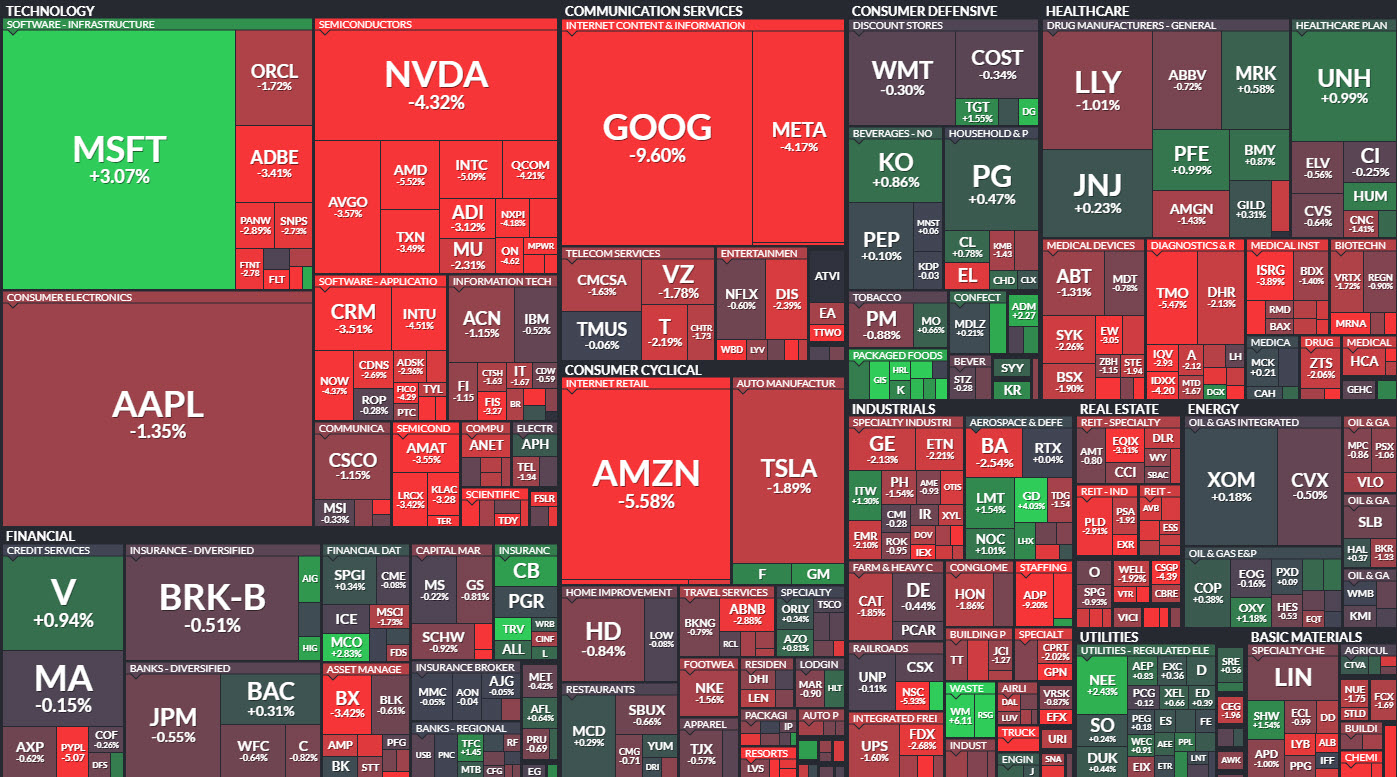
As we have been highlighting for Trend Letter subscribers the last few weeks, we are currently well-positioned for a potential pullback in the S&P. The developments in yesterday and today’s price action has increased the likelihood of such an event. As we have highlighted there are a number of indicators flashing warnings that a correction is due::
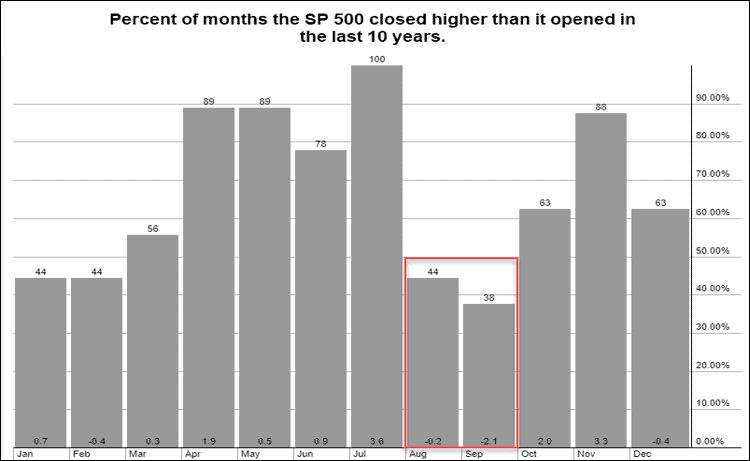
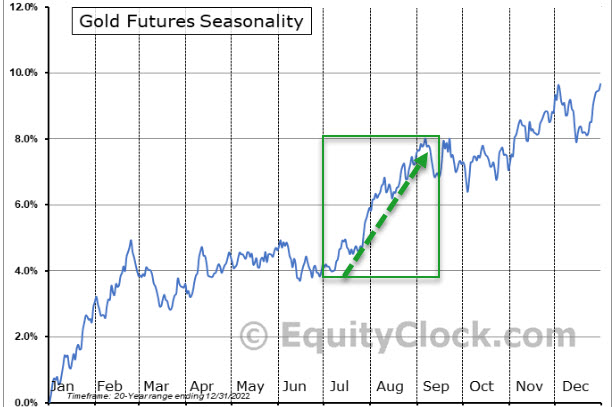
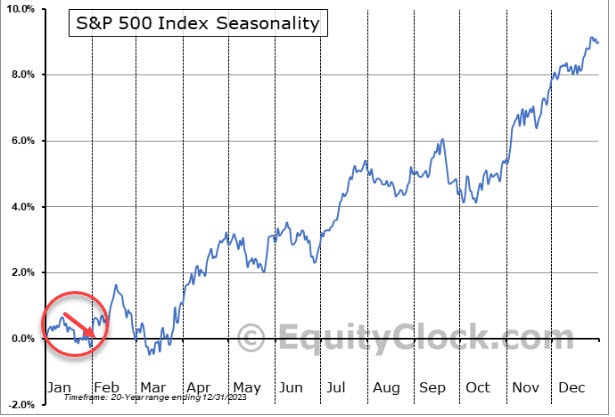
Seasonality:

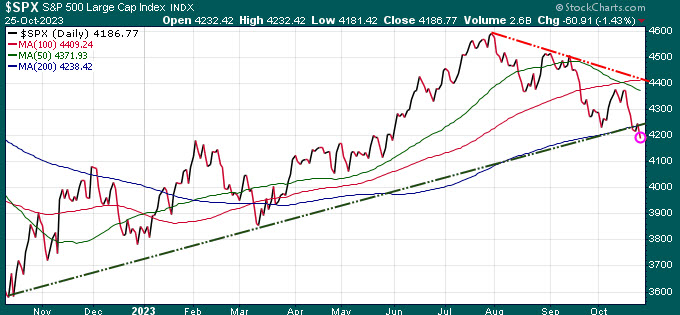
The S&P 500 has  almost perfectly followed the seasonal trend in 2023 and if this continues, then a pullback around now till the end of January is likely.
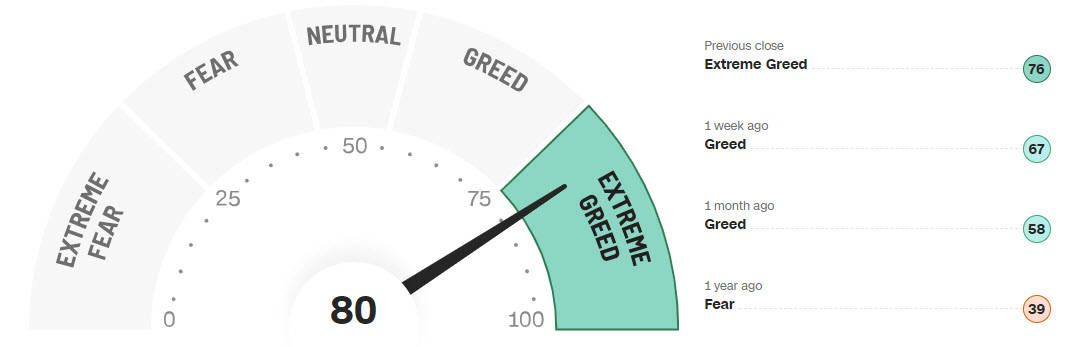
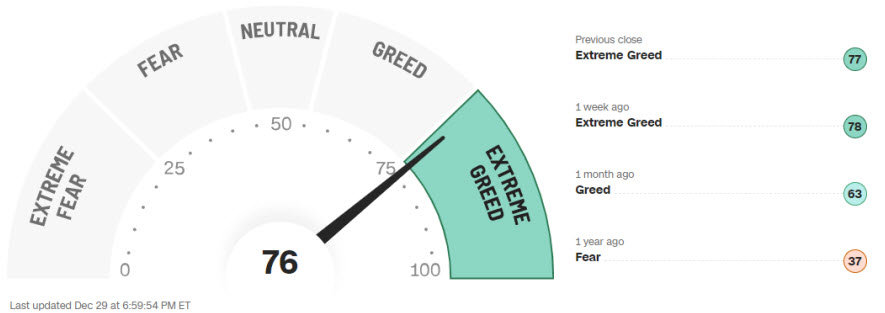
Fear & Greed:

The Fear & Greed Index serves as a tool for assessing stock market dynamics and evaluating the fairness of stock prices. The underlying principle is rooted in the idea that an abundance of fear tends to push down stock prices, while an excess of greed tends to exert the opposite influence, driving prices higher.

As sentiment reaches extreme levels, it often undergoes a swing from one extreme to the opposite. Over the past few weeks, sentiment has been consistently characterized by Greed and has now escalated to Extreme Greed, indicating a potential shift in the opposite direction.
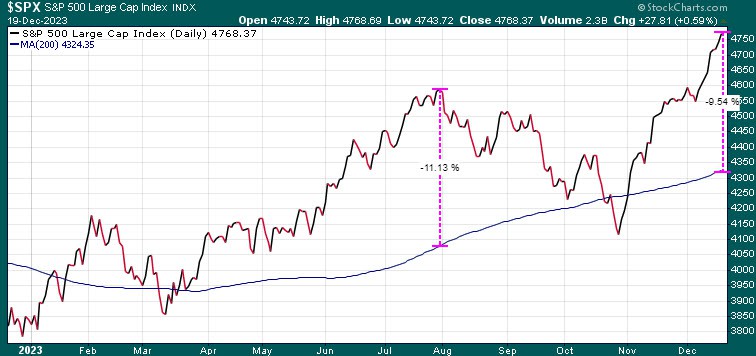
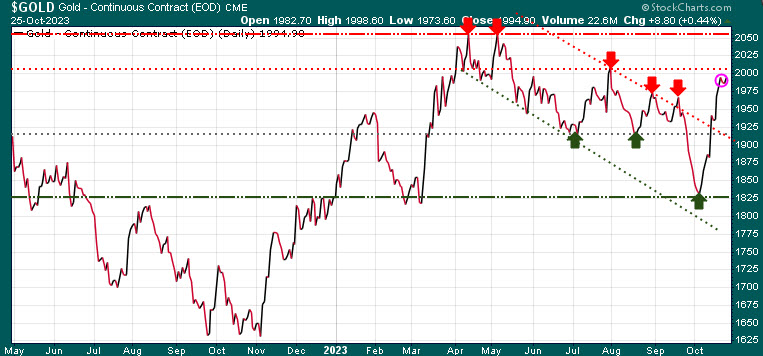
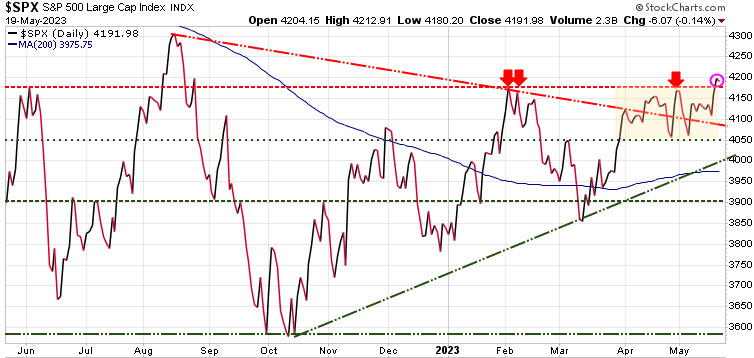
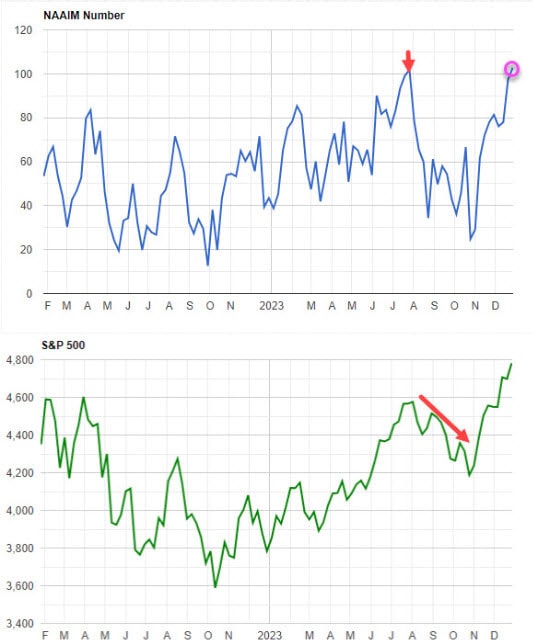
Overexposure:

Another  indicator that we published last week for subscribers is the  NAAIM Exposure Index which represents the average exposure of  fund managers. In October, fund managers were less than 25% exposed to the S&P 500. Today they are over 100% exposed, employing leveraged long strategies. The last time were saw this extreme bullish sentiment was back in July (top arrow) where we saw the start of a ~10% correction in the S&P 500 (lower red arrow).
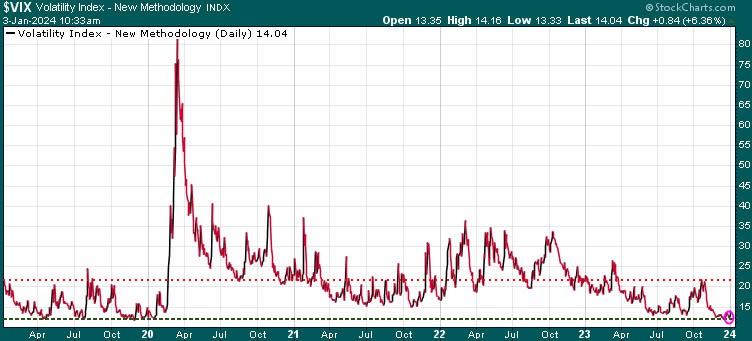
Volatility:

Another signal of caution comes from the VIX Volatility Index. The VIX serves as a metric indicating investors’ expectations regarding near-future stock market fluctuations. Commonly known as the ‘fear gauge,’ the VIX tends to climb in response to heightened uncertainty or fear in the market. Recognized as a contrarian indicator, it often suggests a potential reversal when reaching extreme levels. Presently, the VIX has lingered at historically low levels, signaling an exceptionally bullish sentiment in the markets. However, when sentiment becomes extremely bullish, it implies a dearth of buyers, often indicative of an impending correction.

While we expect a correction in the early to mid-January, we will be looking  to play such a downward move as a buying opportunity.  The year 2024 being an election year in the United States adds an interesting dynamic. Historical patterns suggest that stock market performance tends to improve during election years. This improvement is often linked to the incumbent’s capacity to boost investor enthusiasm through strategic initiatives, such as substantial spending, particularly targeted at significant voter segments like millennials today.

What to watch for:

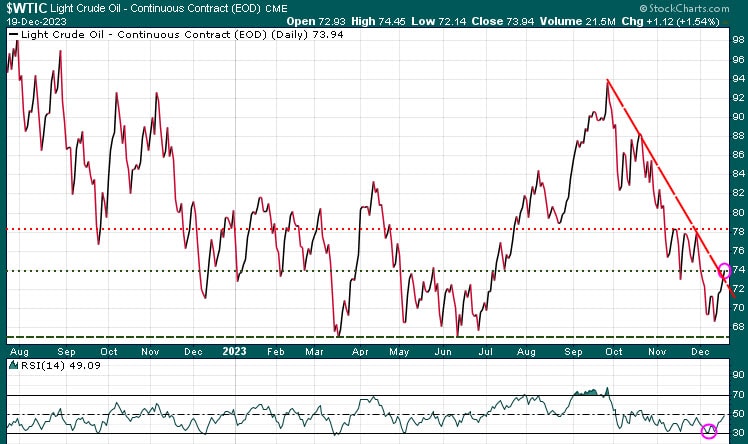
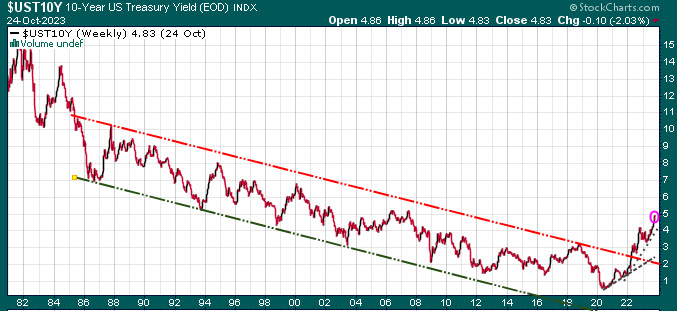
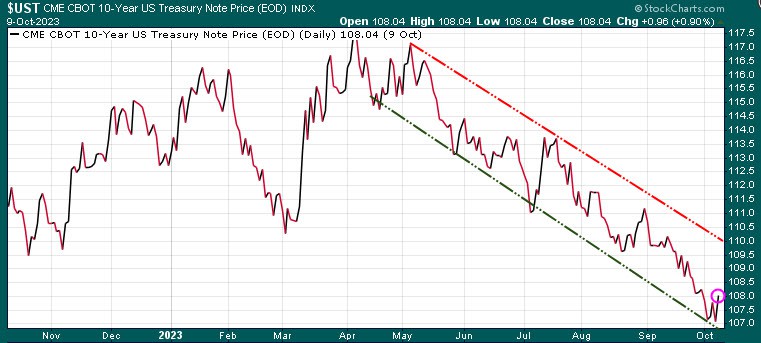
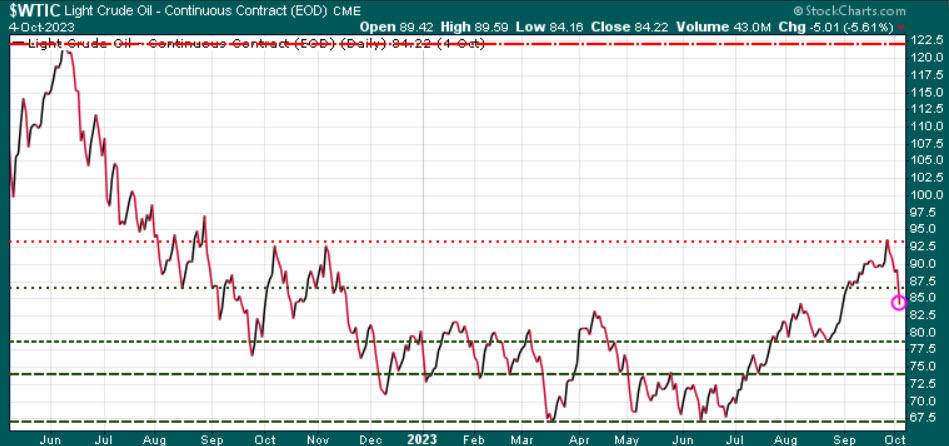
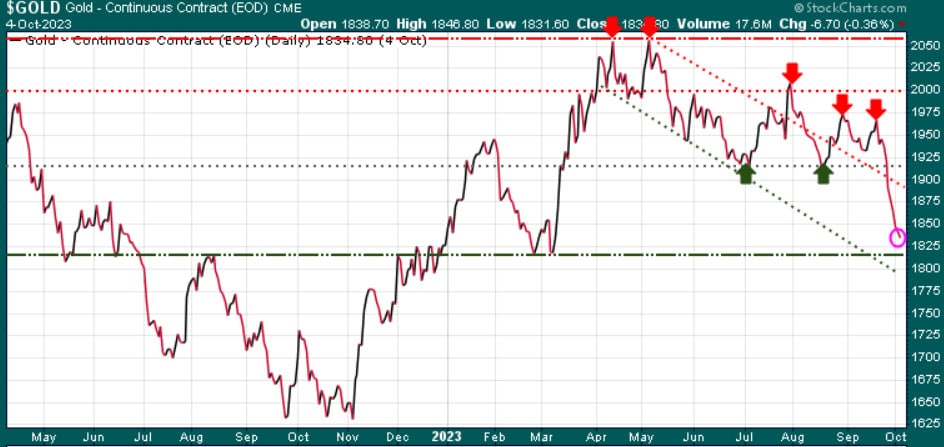
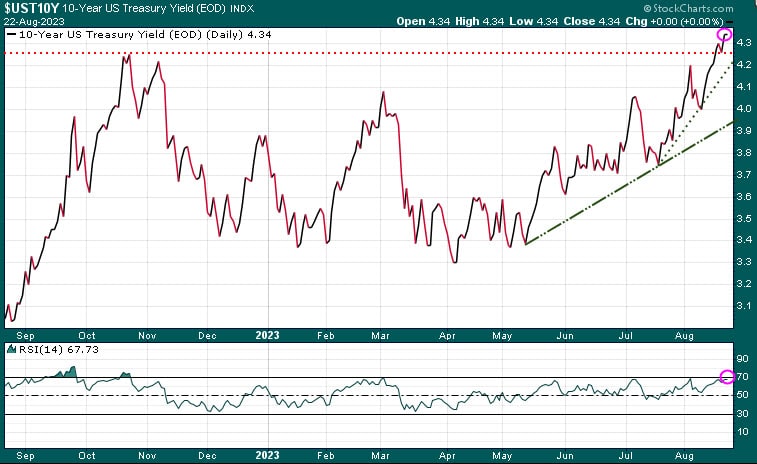
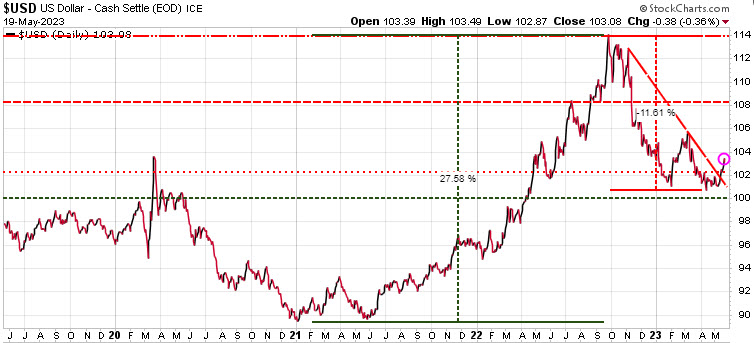
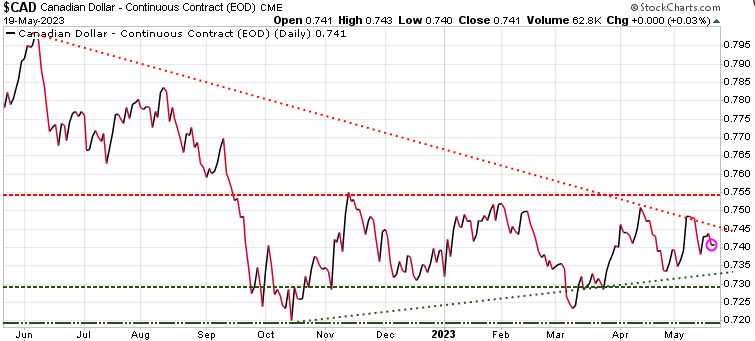
The US dollar rallied strongly from July until October followed by a decline since October, coinciding with a decrease in bond yields. This decline has notably benefited equities. However, the trend appears to have become overextended, prompting a test of the downtrend line for the US dollar. If a breakthrough occurs, it could lead to, at least, a temporary rally in the US dollar, negatively impacting stocks (especially in the tech sector), bonds, precious metals, base metals, and other commodities.

To validate these expectations, we will be monitoring the following indicators:

  • A VIX Volatility rally surpassing 20
  • Fear & Greed Index entering the Fear range
  • NAAIM Index dropping below 60
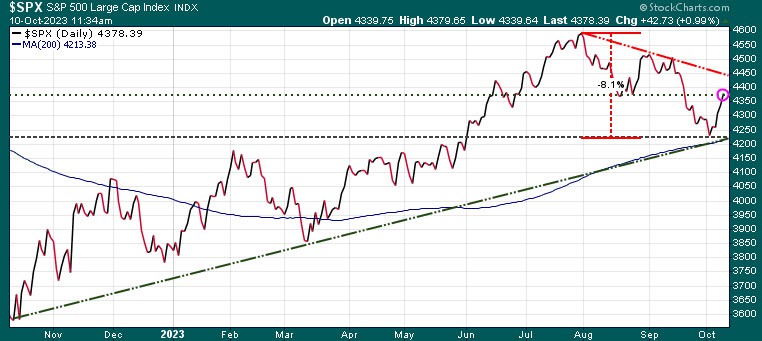
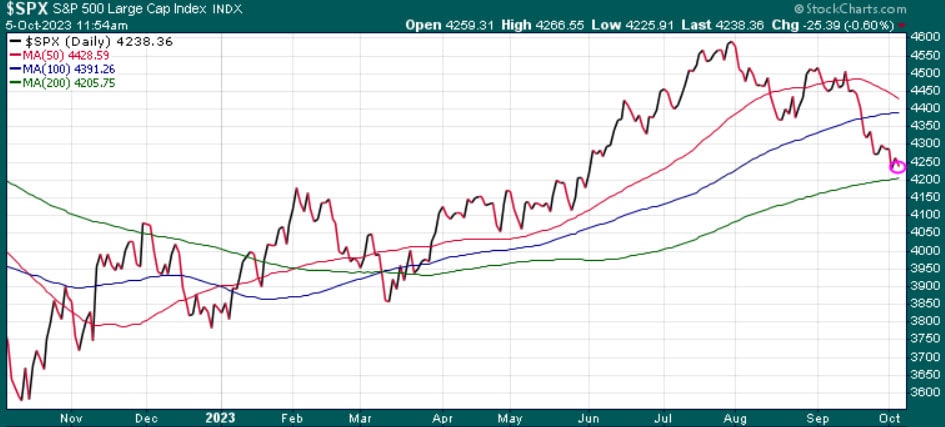
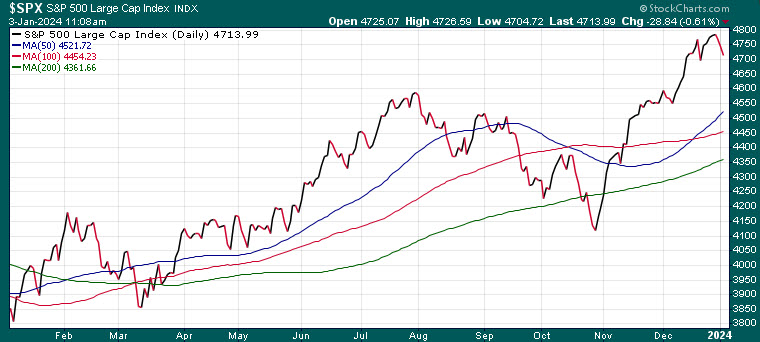
  • S&P 500 testing 50-DMA at 4621, followed by the 100-DMA at 4454, and potentially the 200-DMA at 4361

If we hit these targets, then it could set up a great buying opportunity. Trend letter subscribers receive all BUY & SELL signals.

The forecasts could potentially be bleaker. Escalation of conflicts in the Middle East, tensions between China and Taiwan, and other unforeseen events are factors that could exacerbate the situation. It’s advisable to keep a close eye on your SELL Stops.

Stay tuned!

Market Notes

Optimism abounds!!

Investing  in Stocks

We won’t dispute the momentum in prices. The S&P 500 has surged approximately 16% since October 27, a rally that would typically be considered substantial for an entire year. The Russell 2000 has experienced an even more significant increase of 25% during the same period. Incredibly, the equal-weight S&P 500 Index swiftly transitioned from a 52-week low to a 52-week high in just 33 trading days.

Market sentiment is being swayed by the anticipation of up to three rate cuts in 2024. If you watched our short video on what the  stock market typically does when the Fed cuts rates you will understand that when the Fed cuts rates, history suggests that is not a good time to buy stocks. See short video here.

The markets are extremely overbought here with the 14-day Relative Strength Index (RSI) for the S&P 500 reaching an elevated reading of 87.19, surpassing the generally considered overbought threshold of 70.

Mean reversion is a trading or investing strategy that suggests that prices tend to revert to their historical average over time (eg: 200-dma).  In other words, if a security’s price deviates significantly from its historical average, it is expected to move back toward that average. When we look at the current deviation of the  S&P 500 from its 200-dma, it is getting near levels that are considered extreme, suggesting that it will need to revert closer to that average.

Another indicator flashing that the market is overbought is the Fear & Greed Index which monitors 7 indicators to determine where on the pendulum of extreme fear to extreme greed the markets are at. Today, the Fear & Greed Index is at an Extreme Greed reading.

While the markets can certainly continue to run hot through the rest of the year, investors should  brace themselves for a potential pullback soon.

Investing in Oil

The recent overbought condition of oil (RSI  reading on lower chart) prompted our models to trigger a new trade to capitalize on a potential oil rally. The current seasonally strong period for oil, coupled with escalating geopolitical tensions in the Red Sea, builds a case for a potential uptick in oil prices.

Contrary to these bullish factors, the significant oil production by the US, Iran, and a few other countries continues at a high pace, maintaining elevated output levels.

Stay tuned for further developments!


Market Notes

Market turning point?

Today the markets opened on a positive note, fueled by inflation data that came in cooler than anticipated. This news raised expectations that the Federal Reserve might halt its interest rate hikes and potentially implement cuts in the coming year. While we don’t anticipate any immediate rate cuts, the prevailing sentiment could drive the markets higher as we approach the year-end.

This upward movement exhibited a broad-based rally, which is particularly encouraging. It’s not just the well-known top-performing stocks leading the charge; instead, the market saw widespread participation. It’s worth noting that the Relative Strength Index at the bottom of the chart is nearing oversold territory, hinting at a potential pause. However, with the deceleration in inflation, declining energy prices, and robust seasonality, barring unforeseen events, we anticipate a strong year-end rally.

We had sent out another trade to subscribers the other day and that trade was activated today. This trade will produce double the gains the S&P 500 will gain (and vise visa). If you want to know what that trade is and what other investing strategies we have given subscribers, click here to subscribe at our most compelling offers in recent years. It’s your money – take control!

Market Notes

Tread carefully!

Our mission as an investment newsletter is to research and provide the best information for our subscribers, assisting them to become better, more successful investors.

Navigating through the current market environment continues to be challenging, and we don’t anticipate it getting easier in the very near-term. The unique dynamics of this year have made it a year of adaptation, having to be constantly mindful of fluctuating market uncertainties. which can be a source of stress for investors.

Here’s the single-day heat map illustrating the performance of S&P 500 stocks today. Each stock is depicted as a block, with its size corresponding to its market valuation. The colour of each block signifies whether the stock had a positive or negative performance. Notably, apart from Microsoft, which showed a positive performance, the majority of the ‘Magnificent 7’ tech stocks experienced a challenging day.

The chart below illustrates the performance of the S&P 500 over the past year. It’s evident that from its upward trajectory starting in October ’22 until mid-July of this year, the index experienced a sustained rally. However, from that mid-July juncture, a significant reversal occurred as several sectors changed direction, leading to a decline of approximately 8.75% in the S&P 500 from that point to today’s level.

As depicted on the chart, within this reversal, the S&P 500 has breached three critical support levels: the 50-DMA, 100-DMA, and as of today, the 200-DMA. It has also fallen below its year-long uptrend line, marked by the dashed green diagonal line.

This is the first time the market has dropped below its 200-DMA since the March banking crisis and subsequent Fed rescue effort. Falling below the 200-DMA tends to have a psychological impact on market participants, potentially leading to more cautious investment decisions.

When we look at the tech heavy Nasdaq index, we see that while it has breached its 50-DMA and 100-DMA, it is still trading above its 200-DMA. With today’s (Wednesday) decline, the Nasdaq is now flirting with its 200-DMA as well.

We are seeing some price divergence here, with specific sectors and certain individual stocks trading differently from others. This tends to happen during periods of volatility, often at key turning points. We will be watching this action closely as we enter month end early next week.

What is causing this volatility?

One of the key headwinds for the markets is clearly the expansion of global wars, with the Middle East grabbing the headlines currently.

The markets are facing another significant challenge in the form of increasing bond yields, and this rise in borrowing costs is notably affecting small-cap and tech stocks. After experiencing over four decades of declining yields, there has been a notable shift in this trend with yields now on the rise. Here’s a chart depicting the change in the US 10-year yield.

Is a recession still possible?

For those not familiar with an inverted yield curve, it is when short-term yields are higher than long-term yields. This seems counterintuitive, as most investors would expect to get more yield for a 10-year bond than say a 2-year bond, as the time risk is much greater. When the yield curve inverts, it means that investors are willing to accept lower yields on long-term bonds than on short-term bonds. This suggests investors are pessimistic about the economy and they are expecting lower rates in the future, so they want to lock in long-term at current rates.

An inverted yield curve has been an incredibly accurate leading indicator of a recession. Since 1955, there has been only one time when the yield curve inverted without there being a recession.

As we can see, the yield curve had been inverted from April’22, so over 18 months. But we can also see with the red arrows that recessions (grey shaded area) typically start after the yield curve starts to revert, which it is doing now. This suggests that a recession is very likely, and the timeframe is getting closer, most likely in the first half of 2024.

A recession is very stressful to individuals and families as unemployment rises, reduced spending hurts small businesses, and real estate tends to decline, reducing equity, making it difficult to get credit.

As investors, we need to understand that stocks do not do well in a recession. But, once the recession bottoms, it creates fantastic buying opportunities. Here is a chart showing the last number of recession and we can see the tremendous bull markets once those recessions were over.

Bitcoin goes parabolic

The price of Bitcoin has gone parabolic with the anticipation of the approval of a Bitcoin spot ETF by the US Securities and Exchange Commission (SEC) which some estimate could add close to 75% to the Bitcoin price within a year. The price of Bitcoin is up ~110% so far this year.

Energy

Typically, energy stocks will retreat in tandem with the broader markets. But with the war in the Middle East still very much top of mind, any escalation in that war would boost oil prices and related stocks.  Oil just touched our near-term support target at $82.50 and we now need to see if that level holds. If it does, there is the potential to breach the $90.00 mark. Conversely, should this support level falter, we could see oil price drops to below the $80.00 level.

We took some nice profits off the table when oil hit the $93.00 range, and should it pull back here, we will be sending out BUY Signals to subscribers to add to our positions.

Golds’ glitter

Gold reached our specified target low of 1825 in early October, and then the surge in geopolitical tensions following the attack on Israel attracted risk-on capital into the precious metal. We issued an additional gold trade recommendation for our subscribers, and now we are monitoring gold’s potential movements.

At its recent intraday peak of $2009 last week, gold had surged by over $180.00 from that low point. In the short term, there is resistance at $2000, followed by the previous high at $2060. Key support levels to watch for are $1950, $1925, and the robust support at $1825.

From a technical perspective, gold appears to be overbought at this stage, although it could consolidate within this range. Given its heightened sensitivity to geopolitical risk, a move to test $2060 remains a distinct possibility.

In response to numerous requests, we’ve chosen to reopen our Special Offer from the previous month, considering the heightened market volatility. Click the button below to access those specials with between 40%-65% off regular prices.

Stay tuned!

Market Notes

Market Action Amid Global Tensions

We labeled Friday’s update as ‘Today’s Market Activity: A Critical Factor for Potential BUY Signals.’ However, over the weekend, a conflict erupted in the Middle East. On Monday, the financial markets opened predictably to the Hamas attack on Israel, producing a near-term decline, but then surprisingly, the markets rallied, with the S&P500 closing up 27 points.

So far, here on Tuesday morning, that rally has continued, with the S&P 500 up ~40 points at time of this writing.

Whenever global conflicts arise, the US bond market often emerges as a ‘safe haven’ investment option. This trend was evident on Monday as the sharp decline in bond prices began to reverse, resulting in higher bond values and lower yields.

In Friday’s update, we highlighted the S&P 500 was testing its critical support level, and when it held, we issued a BUY Stop signal, which was triggered on Monday.

We also issued a BUY Stop signal for a gold trade, which hasn’t yet triggered.

Subscribers can anticipate receiving more signals from us, potentially in the next day or two, as we keep a close eye on the energy sector, cannabis, and even the homebuilders for potential opportunities.

Upcoming this week are the PPI and CPI inflation data in the US, so any upside surprise in either of those could send bond yields spiking again, so we need to tread carefully.

Lastly, our exclusive Special Offer, offering discounts ranging from 40% to 65% off regular prices closes at the end of the day TODAY.  It’s your money, take control!

Stay tuned!

Market Notes

New BUY Stops Sent To Subscribers

In Friday’s update titled ‘Today’s Market Activity Holds Key to Potential BUY Signals,’ we made note of the fact that “we have a few sectors that are displaying oversold conditions and are getting ripe for some BUY signals. We will observe how today closes and will provide our subscribers a brief update Saturday morning.” Following through on this commitment, this morning we took action and issued two new BUY Stop signals to our subscribers.

October carries substantial significance in the financial markets, as it historically marks a period when the stock market often reaches its bottom. Major indexes and leading stocks have, on many occasions, experienced significant losses in October, often exacerbating the sharp declines from prior months. However, it is during these periods of significant losses that the market tends to pivot and establish an upward trajectory that extends through the end of the year.

Within our analytical framework, our models monitor an array of indicators, including but not limited to the Relative Strength Index (RSI), Moving Averages, Moving Average Convergence Divergence (MACD), Commodity Channel Index (CCI), Bollinger Bands, Put/Call Ratio, Fibonacci Retracement, and many others.

When our models detect the convergence of several of these indicators, it triggers either BUY or SELL Stops. Initially, our models provide warning signs indicative of a potential shift in the market trend. As this trend becomes more discernible and substantiated, the models then issue strong BUY or SELL Signals. Over the course of this week, we have received several BUY warnings, signifying that our models are sensing a shift in market conditions.

For those who haven’t yet taken advantage of our exclusive Special Offer, offering discounts ranging from 40% to 65% off regular prices, will remain available until the end of the day today. It’s your money, take control!

Stay tuned!

Happy Thanksgiving Canada!

No BUY Signal just yet

As an investment newsletter, we strive to bring the best information to assist those who want to become better, more successful investors.

Bond yields:

Investing in bonds. The recent market turmoil is predominantly driven by concerns over long-term bonds and their elevated yields, as investors brace for the prospect of enduring high borrowing costs. The underlying issue for the long bond market stems from the ongoing accumulation of substantial deficits and debt by the US government, compounded by the fact that China and Japan, historically the largest purchasers of US bonds, are now sellers of them.

Currently, the US is making interest payments of $909 billion on its debt, as reported by the Federal Reserve. With the primary buyers of US debt transitioning into sellers, a pressing question emerges: who will step in to purchase this debt? As potential buyers remain on the sidelines, market dynamics are pushing yields higher in an attempt to attract new investors.

Remember, the Fed only controls the short-term rates, the market controls long-term rates.

Equities:

Investing in stocks. Although the recent selloff in equities showed some signs of slowing down on Wednesday, investors remain vigilant for any potential resurgence in volatility, particularly if the upcoming US non-farm payrolls data on Friday exceeds expectations. On Wednesday, the S&P 500 made a noteworthy rebound, surging by 34.30 points to reach 4,263.70, thanks to early buyers stepping in. However, as of this moment, it has started the day with a lower opening and has retraced much of those gains, currently down by 25.39 points.

Oil:

Investing in oil. In our previous Trend Letter last week, we anticipated a retracement in oil prices from their peak at 94.00, prompted by an elevated Relative Strength Index (RSI) reading of 78.00, with any reading above 70 indicating an extreme overbought condition. Subsequent to reaching that high, oil has experienced a decline of approximately 10.00, settling around our initial support marker at $86.00, concluding Wednesday’s session at 84.22. This morning, there has been a slight uptick, but at the time of this writing, the market remains relatively flat. Our next anticipated support level for oil stands at 79.70, and we expect it to test that level in the near future.

Gold:

Investing in gold. Gold continued its struggles Wednesday, down ~7.00 to 1834.80. Over the past few months our projected lower target for gold has been 1825. At the time of this writing gold is trading at 1828 and is exhibiting oversold conditions. We are on the verge of our models issuing a BUY Signal, but it hasn’t triggered it yet.

It’s essential to emphasize that we are trend traders, requiring more than just an oversold market condition. The market must exhibit a convincing rally potential. While we believe we are approaching that point, confirmation is still pending.

As soon as we receive that confirmation, we will promptly notify our subscribers. If you haven’t subscribed yet, our exclusive Special Offer, providing discounts ranging from 40% to 65% off regular prices, remains accessible until this Saturday. It’s your money, take control!

Stay tuned!

Market Notes – September 1/23

Some investment news for those looking to invest in gold, invest in stocks, or currencies, and commodities.

Each week the Trend Letter, displays weekly heat map of the S&P 500. It is a great visual of the equity market that holds stocks many North Americans own. Each of the 500 stocks is shown in a box, & the size of the box represents its market valuation, and the colour of each box tells you how that stock did, GREENS being gains & REDS being losses.

As we can see, for the week, big tech stocks led the way higher. There was also a lot of green throughout most other  sectors, with utilities and healthcare being the main exceptions.

On the daily heatmap a bit of a different story, with some big tech in red.

Looking at the BIG picture, the S&P 500 is still solidly in a long-term uptrend channel, since 2009. If we were to test the initial support level  of that long-term uptrend channel, we would see a correction to the 4000 level, which would be a ~11% decline  from the current 4500 range

Based on seasonality, September is the weakest month for the S&P 500.

If we do get a decent correction in September, it could provide a good buying opportunity. Sectors that have looked good are oil, uranium, tech, gold, base materials and even cannibals cannabis, what with US health dept urging the DEA to relax restrictions. We will see if these will remain strong after Labour Day, or if the negative September seasonals take over.

What we do at Trend Letter is track those key support & resistance levels, looking for changes in trend, and then and alert subscribers when trends change.

In Martin’s interview with Jim Goddard on This Week in Money on Friday (interview start at 44:39), he promised to show the chart below. If we look at the last number of times the Fed CUT rates recently, so 2000, 2007 and 2020…each time was driven by the economy falling into a recession (grey shaded bars). And when they CUT rates (red arrows) the S&P 500 had sharp declines. In each of those CUTTING phases it was not until the Fed STOPPED cutting rates that the S&P 500 started to recover (green arrows).

For those investing in gold, the key numbers are::

  • Near-term resistance is 2000, 2040, then 2070, which was that double top in April-May
  • Next key support level is 1915, 1900, 1880, then & really strong support at 1825
  • If it does drop to 1825, that would likely trigger several new BUY alerts

In Martin’s interview with Jim Goddard, he explained why he still feels a recession is very possible. He outlined the two key leading indicators, the inverted yield curve and the Conference Board’s Leading Economic Index (LEI).  Both of these have an almost perfect record in forecasting recessions. Both are forecasting a recession coming soon.

A yield curve is inverted when short-term yields are higher than long-term yields. An inverted yield curve is a leading indicator of a recession and since 1955 (68 years), there has been only one time where the yield curve inverted without there being a recession.Recently, the yield curve is the most inverted it has been in over 40 years. Recessions don’t start when the yield curve inverts, but rather when it starts to ‘uninvert’ (red arrows).

This chart clearly shows that for each of the last 6 recessions, they all started after the yield started to rise. Today, the yield curve is starting to ’uninvert’ (circle).

The other indicator with a near perfect record of forecasting a recession is the Conference Board’s Leading Economic Index, which looks at 10 components across the US economy. That index, again in its latest report last week, is firmly saying a recession is coming.


Oil has had a great week after dropping down to the 80.00 level, it has rallied big time this week, and closed Friday at 85.55.  The big bump this week came after a massive 11.5 million barrel drawdown in US crude inventories. Also, we have the Saudi Arabia production falling and they, plus potentially Russia, are expected to extend the production cuts into the end of October.

Stay tuned!

We are offering discounted prices for our three services and with each new subscription this week, we will donate $100 to Special Olympics.  See Special Offers below.

 Trend Letter:
Since start-up in 2002 Trend Letter has provided investors with a great track record, giving exceptionally accurate information about where the markets are going, and it has explained in clear, concise language the reasons why. Using unique and comprehensive tools, Trend Letter gives investors a true edge in understanding current market conditions and shows investors how to generate and retain wealth in today’s climate of extreme market volatility.

A weekly publication covering global bonds, currencies, equities, commodities, & precious metals. Publishes every Sunday evening, covers equites, currencies, precious metals, commodities, and bonds. Each weekly issue is about 50 pages, mostly charts, with key bullet points to make easy to understand. A 10-15 min read

Timer Digest says“Trend Letter has been a Timer Digest top performer in our Bond and Gold categories, along with competitive performance for the intermediate-term Stock category.”


Technical Trader:
Trend Technical Trader (TTT) is a premier hedging service, designed to profit in both up and down markets.

Our hedging strategy empowered  TTT subscribers to not only protect wealth from serious losses during markets crashes, it allowed them to be positioned to make significant gains as markets crashed.

TTT isn’t just a hedging service.  Its timing strategies have returned fantastic gains on the long side. See examples here

Included is our proprietary Gold Technical Indicator (GTI).


Trend Disruptors:
Disruptive technology trends will propel our future and the reality is that no industry will go untouched by this digital transformation. At the root of this transformation is the blurring of boundaries between the physical and virtual worlds. As digital business integrates these worlds through emerging and strategic technologies, entirely new business models are created.

Trend Disruptors is a service for investors seeking to invest in advanced, often unproven technology stocks on the cheap, with the objective to sell them when masses finally catch on. Covering Artificial Intelligence (AI), Virtual Reality (VR), Augmented Reality (AR), 5G, Quantum Computing & many more.

All subscriptions in $US

Special Offers

ServiceRegular PriceSpecial PriceSavingSubscribe
Trend Letter$599.95$349.95$250Trend Letter $349.95
Technical Trader$649.95$349.95$300 Trend Technical Trader $349.95
Trend Disruptors$599.95$349.95$250 Trend Disruptors $349.95
Better Deals
Trend Letter + Technical Trader$1,249.90$549.95$699.95 Trend Letter & Technical Trader $549.95
Trend Letter + Trend Disruptors$1,199.90$549.95$649.95 Trend Letter & Trend Disruptors $549.95
Technical Trader + Trend Disruptors$1,249.90$549.95$699.95 Technical Trader & Trend Disruptors $549.95
Best Deal
Trend Suite: Trend Letter + Technical Trader + Trend Disruptors$1,849.85$649.95$1,199.90 Trend Suite: TL + TTT + TD $649.95
Market Notes

Navigating the Currents of Rising Interest Rates and Market Uncertainties

Rising yields

The significant surge in interest rates throughout 2022 has been extensively documented and has deeply impacted investors, leading to diminished performance in both the stock and bond (debt) markets over the past year. Coming into 2023, the common theory was that the pronounced and continuous escalation of rates would ease, as the primary focus would shift from combating high inflation to addressing slower growth. Although this scenario did play out during much of the current year, longer-term rates has seen a marked increase in recent weeks. Notably, the 10-year Treasury yield reached its highest point since 2007 this week.

As highlighted in recent Trend Letter updates, the notable increase in interest rates can be attributed primarily to a shift in perceptions surrounding the Federal Reserve’s policy. The previously optimistic view held by the market, anticipating swift changes in the Fed’s stance including potential rate cutbacks, has encountered a dose of reality. The persistent strength in economic growth is leading the markets to now acknowledge that the Fed intends to do as it has been saying it intended to do, keep its policy rate ‘higher for longer.’ This adjustment is now manifesting in higher longer-term yields.

As we look at the bottom of the chart, we can see that based on RSI, this rise in yields is getting technically overdone. Fed Chair Powell speaks from Jackson Hole on Friday, and should he be overly hawkish, these yields will move even higher. Conversely, a dovish tone in his communication could potentially prompt a moderation in rates.

Mortgage rates

Naturally, with the increase in the 10-year yield, there is a corresponding uptick in mortgage rates. Presently, 30-year mortgage rates in the US have surpassed 7%, marking their highest point since April 2002.

Massive government debts

In their efforts to rein in inflation, the Bank of Canada and the US Federal Reserve are confronted with a significant adversary: the substantial fiscal outlays by their respective federal governments. In the case of the US, within the initial 52 business days after the debt ceiling accord was reached in early June, government expenditure has reached an astounding $1.72 trillion. This equates to an average daily expenditure exceeding $33 billion.

As these governments intensify their spending and subsequently accumulate more debt, they must then secure additional funds to support these financial outlays. Consequently, they find themselves compelled to repeatedly access the bond market to issue more bonds. This sequence of events contributes to the elevation of interest rates, thus heightening inflationary pressures.

The following visual underscores the level of unsustainability of the US debt. While Canada’s situation may not be as dire as that of the US, the trend is similar.

Debt servicing costs

Rising interest rates impact consumers, leading to increased mortgage and loan payments. Governments also face growing financial responsibilities, especially regarding interest on their mounting debt. According to the St. Louis Federal Reserve, the US is currently spending around $970 billion solely on interest payments—a significant allocation for debt servicing, nearing the trillion-dollar mark.

Food and energy inflation

Two other significant contributors to inflation are energy and food. Following its dismal performance in 2022, the oil sector has shown a notable recovery, breaking out of its downward trend. In recent weeks, oil has stood out as a positive performer. The subsequent chart illustrates that oil experienced an overbought condition last week and has since undergone a modest retracement. A potential buying opportunity might present itself if a pullback occurs to the 76.00 level.

Those who have been recently purchasing beef are well aware of the significant increase in cattle prices that has taken place since October.

Nvidia leads the markets

Later today, we have the eagerly anticipated Nvidia earnings report, and later this week, Jerome Powell is scheduled to speak at the Jackson Hole event, both of which represent significant uncertainties for the market. Nvidia is set to release its earnings after Wednesday’s market close, and the prevailing sentiment is that there will be another massive earnings beat and an optimistic projection concerning the demand for artificial intelligence. Analysts from various financial institutions are currently revising their price targets in anticipation of these earnings. It’s worth noting that the stock is currently trading at a valuation of 233 times its earnings, necessitating an extraordinary positive surprise to maintain the remarkable upward trajectory. While there’s always a possibility that Nvidia pulls off the massive earnings beat, we will be watching the 405.00  support level. If that level is breached, we could see much lower levels and it will likely drag the rest of the market down with it.

Fed speak

Federal Reserve Chair Jerome Powell is slated to deliver a speech at 10 AM during the Jackson Hole event on Friday. This presentation has captured the undivided attention of the global financial community. Powell has remained resolute in his mission to combat inflation, all the while suggesting that yields will continue to climb as part of this effort. Up to now, the markets did not believe the Fed, leading to a scenario often described as ‘fighting the Fed.’ The pivotal question now arises: Will the market accept Powell suggesting that stronger growth will require even higher rates?

We keep tabs on all sectors in the Trend Letter and issue a full report each Sunday evening. If you are not a subscriber but would like to get a deeper insight into the driving forces behind these markets, visit us at www.thetrendletter.com or email us at info@thetrendletter.com.

Stay tuned!

We are offering discounted prices for our three services & with each new subscription this week, we will donate $100 to Special Olympics.  See below.

 Trend Letter:
Since start-up in 2002 Trend Letter has provided investors with a great track record, giving exceptionally accurate information about where the markets are going, and it has explained in clear, concise language the reasons why. Using unique and comprehensive tools, Trend Letter gives investors a true edge in understanding current market conditions and shows investors how to generate and retain wealth in today’s climate of extreme market volatility.

A weekly publication covering global bonds, currencies, equities, commodities, & precious metals. Publishes every Sunday evening, covers equites, currencies, precious metals, commodities, and bonds. Each weekly issue is about 50 pages, mostly charts, with key bullet points to make easy to understand. A 10-15 min read

Timer Digest says“Trend Letter has been a Timer Digest top performer in our Bond and Gold categories, along with competitive performance for the intermediate-term Stock category.”


Technical Trader:
Trend Technical Trader (TTT) is a premier hedging service, designed to profit in both up and down markets.

Our hedging strategy empowered  TTT subscribers to not only protect wealth from serious losses during markets crashes, it allowed them to be positioned to make significant gains as markets crashed.

TTT isn’t just a hedging service.  Its timing strategies have returned fantastic gains on the long side. See examples here

Included is our proprietary Gold Technical Indicator (GTI).


Trend Disruptors:
Disruptive technology trends will propel our future and the reality is that no industry will go untouched by this digital transformation. At the root of this transformation is the blurring of boundaries between the physical and virtual worlds. As digital business integrates these worlds through emerging and strategic technologies, entirely new business models are created.

Trend Disruptors is a service for investors seeking to invest in advanced, often unproven technology stocks on the cheap, with the objective to sell them when masses finally catch on. Covering Artificial Intelligence (AI), Virtual Reality (VR), Augmented Reality (AR), 5G, Quantum Computing & many more.

All subscriptions in $US

Special Offers

ServiceRegular PriceSpecial PriceSavingSubscribe
Trend Letter$599.95$349.95$250Trend Letter $349.95
Technical Trader$649.95$349.95$300 Trend Technical Trader $349.95
Trend Disruptors$599.95$349.95$250 Trend Disruptors $349.95
Better Deals
Trend Letter + Technical Trader$1,249.90$549.95$699.95 Trend Letter & Technical Trader $549.95
Trend Letter + Trend Disruptors$1,199.90$549.95$649.95 Trend Letter & Trend Disruptors $549.95
Technical Trader + Trend Disruptors$1,249.90$549.95$699.95 Technical Trader & Trend Disruptors $549.95
Best Deal
Trend Suite: Trend Letter + Technical Trader + Trend Disruptors$1,849.85$649.95$1,199.90 Trend Suite: TL + TTT + TD $649.95
Market Notes

Market Notes – May 19/23

After receiving positive updates from retailers that reinforced the absence of an impending recession, the stock market surpassed the trading range that had confined it since February. This breakthrough triggered significant short covering and a surge of investment in the technology sector index, once again spearheaded by the mega-cap companies, as we have highlighted all year.

Once again, Big Tech, and mainly the 8 Big Tech stocks have accounted for almost all of the gains for the year in the broad markets. The Nasdaq 100 has jumped to a new all-time high this week, and Microsoft and Apple now make up 14% of the S&P 500 market cap. Combined, they have added over $1 trillion in value so far in 2023.

If not for the AI frenzy, stock indices would be down for the year, So, it’s been a very distorted bullish rally.

After three failed attempts (red arrows) since February, the S&P 500 broke above its key resistance level of 4175. If it can break and hold above 4200, then it could have a rally and test the August high at 4305. A break below 4050 would open the door for a more significant decline.

In speaking on This Week in Money, Martin was asked if the Fed starts cutting rates will it jump start the  markets. While the masses believe that to be true. Martin highlighted that history says quite the opposite happens. Typically, when the Fed PAUSES after a series of rate hikes, there is a brief uptick in the markets.  But what the red arrows on the chart below shows, it is when the Fed starts to CUT rates, that the big losses occur.

This makes sense, as the reason the Fed starts cutting rates is the economy is in trouble and likely headed for a recession, so investors dump stocks because stocks DO NOT do well in a recession. What the chart shows is the markets typically fall as rates are cut and not until the FED STOPS CUTTING (green arrows) do stocks start to rise again.

Currencies:

The $US was very strong from early 2021, when the Fed started aggressively raising rates till Sept 2022, and over that 22 month period the $US jumped over 27%.

Back in October, we called for a top in the $US and since then it has fallen almost 12%. But in the last 7 weeks, the $US has been forming a base formation and in the last 2 weeks has been rising, having now broken above that downtrend line from last fall (red diagonal line), and  also breaking above the tight trading range it has been in since mid March.


Why is this happening? One thought we have is that for most of the past decade the mantra on Wall Street has been ‘Don’t Fight The Fed.’  But ever since the Fed started to raise interest rates, the markets HAVE been fighting the Fed, not believing they would continue to raise rates. For most of the past year, the Fed, Bank of Canada and the ECB have all stated that they will keep rates high until inflation is near 2%. Today, inflation in the US is 4.9%, in Canada it is 4.4%, and in most of Europe it is over 7%. That suggest these central banks DO NOT want to cut rates, but at some point they will likely have to, due to some serious hit to the economy.

For now, the $US is looking like it is getting its legs.

For the $CAD, just like most every other currency, it trades inverse to the $US. The $CAD has been trading in a tight range between 72.5 and 75.50.  The $CAD is also forming a wedge pattern where it will soon break out either up or down.

Gold:

Gold  and silver have had a terrific couple of runs recently; from November to late January, then another from early March to early May (green diagonal arrows).

Gold has twice tested key resistance at 2060 (red arrows) and even spiked intra-day to 2083 about a couple of weeks ago. But since then, we have seen gold and silver decline, with gold down ~$140 from that intra-day high of 2083. On Thursday, gold hit our target low at 1950 and has bounced Friday with debt ceiling talks breaking down.

Silver was down over 10% in a little over 2 weeks before Friday’s bounce. In BULL markets silver outperforms gold and in BEAR markets silver underperforms gold.

One thing that we have been watching is that the mining stocks have been lagging the metals – something we are keeping an eye on


We are in a pullback here, which gold and  silver needed, so that’s healthy. We think gold and silver will continue to outperform the S&P 500 for the next few years. One of the big drivers for gold will be the loss of confidence investors have in government. Once that confidence is broken, we expect gold to rise along with the $US as safe-haven plays.

Based on seasonality, gold and silver typically have a great run starting from July till September.

We suggest buying the dips.

Stay tuned!

Special Offers

Trend Letter:
Since start-up in 2002 Trend Letter has provided investors with a great track record, giving exceptionally accurate information about where the markets are going, and it has explained in clear, concise language the reasons why. Using unique and comprehensive tools, Trend Letter gives investors a true edge in understanding current market conditions and shows investors how to generate and retain wealth in today’s climate of extreme market volatility.

A weekly publication covering global bonds, currencies, equities, commodities, & precious metals. Publishes every Sunday evening, covers equites, currencies, precious metals, commodities, and bonds. Each weekly issue is about 50 pages, mostly charts, with key bullet points to make easy to understand. A 10-15 min read

Timer Digest says“Trend Letter has been a Timer Digest top performer in our Bond and Gold categories, along with competitive performance for the intermediate-term Stock category.”


Technical Trader:
Trend Technical Trader (TTT) is a premier hedging service, designed to profit in both up and down markets.

Our hedging strategy empowered  TTT subscribers to not only protect wealth from serious losses during markets crashes, it allowed them to be positioned to make significant gains as markets crashed.

TTT isn’t just a hedging service.  Its timing strategies have returned fantastic gains on the long side. See examples here

Included is our proprietary Gold Technical Indicator (GTI).


Trend Disruptors:
Disruptive technology trends will propel our future and the reality is that no industry will go untouched by this digital transformation. At the root of this transformation is the blurring of boundaries between the physical and virtual worlds. As digital business integrates these worlds through emerging and strategic technologies, entirely new business models are created.

Trend Disruptors is a service for investors seeking to invest in advanced, often unproven technology stocks on the cheap, with the objective to sell them when masses finally catch on. Covering Artificial Intelligence (AI), Virtual Reality (VR), Augmented Reality (AR), 5G, Quantum Computing & many more.

All subscriptions in $US

Special Offers

ServiceRegular PriceSpecial PriceSavingSubscribe
Trend Letter$599.95$349.95$250Trend Letter $349.95
Technical Trader$649.95$349.95$300 Trend Technical Trader $349.95
Trend Disruptors$599.95$349.95$250 Trend Disruptors $349.95
Better Deals
Trend Letter + Technical Trader$1,249.90$549.95$699.95 Trend Letter & Technical Trader $549.95
Trend Letter + Trend Disruptors$1,199.90$549.95$649.95 Trend Letter & Trend Disruptors $549.95
Technical Trader + Trend Disruptors$1,249.90$549.95$699.95 Technical Trader & Trend Disruptors $549.95
Best Deal
Trend Suite: Trend Letter + Technical Trader + Trend Disruptors$1,849.85$649.95$1,199.90 Trend Suite: TL + TTT + TD $649.95