Investing in currencies can be very profitable. Currencies fluctuate, generally, when the US dollar is strong , most other currencies are weaker. Countries like Canada and Australia are heavy commodity based economies. This means that those currencies do well when commodities are rising.

Investing in currency involves buying the currency of one country while selling that of another. This is done through the foreign exchange market, or ‘forex.’

Forex trading always happens in pairs. For a transaction to be complete, one currency has to be exchanged for another. For example, you might buy US dollars and sell Euros or vice versa. While you could technically exchange any foreign currency that’s traded on the market exchange for another, it’s more common to trade using pre-establishing pairings.

Forex trading attempts to capitalize on fluctuations in currency values. It’s similar to trading stocks. You want the currency you buy to increase in value so you can sell it at a profit. Your profit tied to the currency’s exchange rate, which is the ratio of one currency’s value against another.

Using Exchange Traded Funds (ETFs) to trade currencies

While any investor can trade currencies through a Forex brokerage, they can also use Exchange Traded Funds to easily trade currencies; as easy as trading any stock.  With currency ETFs, you can invest in foreign currencies just like you do in stocks or bonds. These instruments replicate the movements of the currency in the exchange market by either holding currency cash deposits in the currency being tracked or using futures contracts on the underlying currency.

Either way, these methods should give a highly correlated return to the actual movements of the currency over time. These funds typically have low management fees as there is little management involved in the funds, but it is always good to keep an eye on the fees before purchasing.

Here are a few some samples of ETFs that trade global currencies. Note there is an ETF for most global currencies.

US Dollar – UUP.NYSE
Euro – FXE.NYSE
Japanese Yen – FXY.NYSE
British Pound – FXB.NYSE
Canadian Dollar – FXC.NYSE
Swiss Franc – FXF.NYSE
Chinese Yuan – CYB.NYSE

It is also possible to trade leveraged currency ETFs. For example, our subscribers have profited greatly by using the EUO ETF which is a 2X short Euro ETF.

Note that with the US dollar being the world reserve currency, we typically see an inverse relationship between the US dollar and other currencies. For example, when the US Dollar is strong, most currencies underperform.

The Trend Letter covered global currencies in each of its weekly reports.

Market Notes – September 1/23

Some investment news for those looking to invest in gold, invest in stocks, or currencies, and commodities.

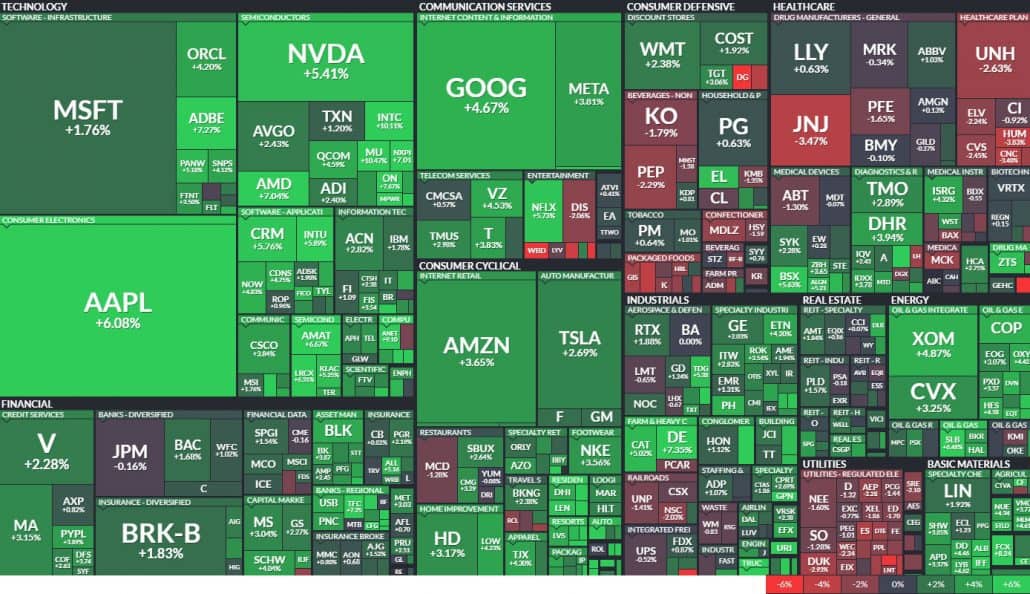
Each week the Trend Letter, displays weekly heat map of the S&P 500. It is a great visual of the equity market that holds stocks many North Americans own. Each of the 500 stocks is shown in a box, & the size of the box represents its market valuation, and the colour of each box tells you how that stock did, GREENS being gains & REDS being losses.

As we can see, for the week, big tech stocks led the way higher. There was also a lot of green throughout most other  sectors, with utilities and healthcare being the main exceptions.
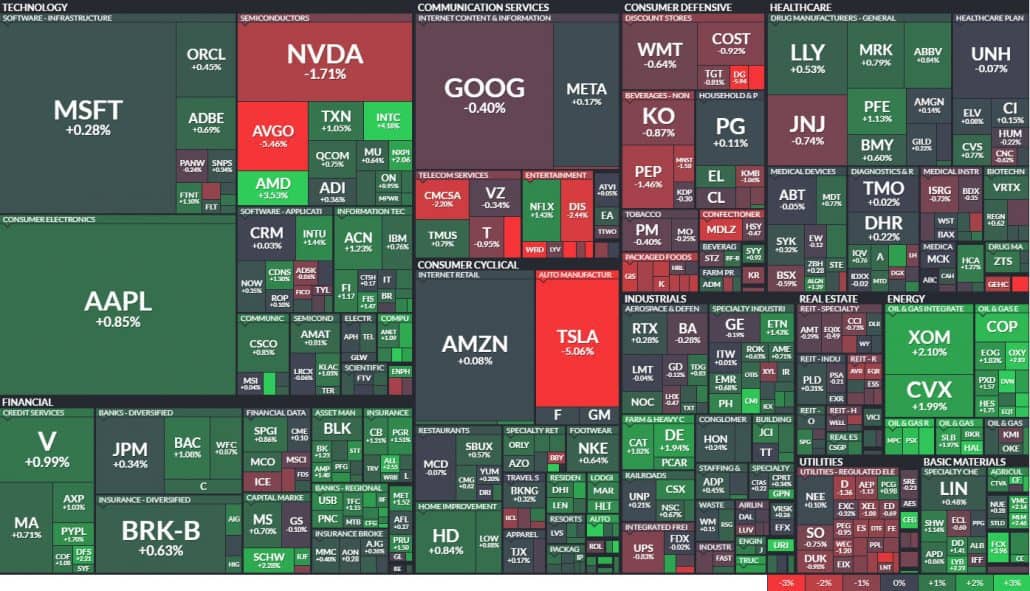
On the daily heatmap a bit of a different story, with some big tech in red.
Looking at the BIG picture, the S&P 500 is still solidly in a long-term uptrend channel, since 2009. If we were to test the initial support level  of that long-term uptrend channel, we would see a correction to the 4000 level, which would be a ~11% decline  from the current 4500 range

Based on seasonality, September is the weakest month for the S&P 500.
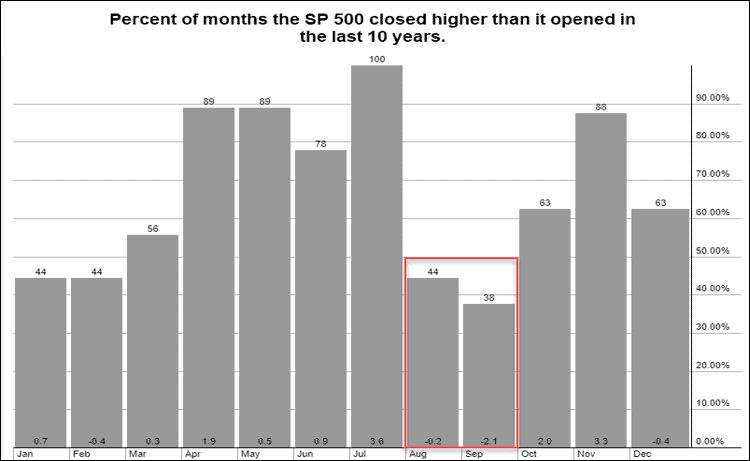
If we do get a decent correction in September, it could provide a good buying opportunity. Sectors that have looked good are oil, uranium, tech, gold, base materials and even cannibals cannabis, what with US health dept urging the DEA to relax restrictions. We will see if these will remain strong after Labour Day, or if the negative September seasonals take over.

What we do at Trend Letter is track those key support & resistance levels, looking for changes in trend, and then and alert subscribers when trends change.

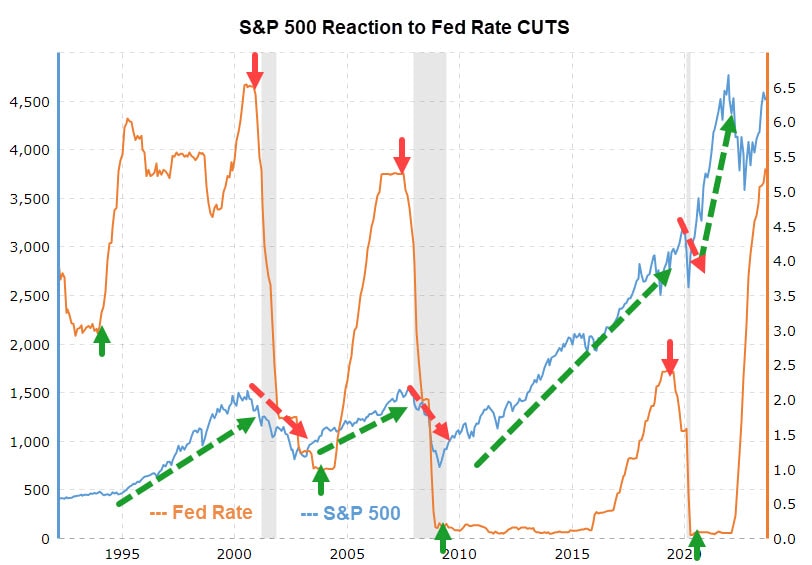
In Martin’s interview with Jim Goddard on This Week in Money on Friday (interview start at 44:39), he promised to show the chart below. If we look at the last number of times the Fed CUT rates recently, so 2000, 2007 and 2020…each time was driven by the economy falling into a recession (grey shaded bars). And when they CUT rates (red arrows) the S&P 500 had sharp declines. In each of those CUTTING phases it was not until the Fed STOPPED cutting rates that the S&P 500 started to recover (green arrows).
For those investing in gold, the key numbers are::

  • Near-term resistance is 2000, 2040, then 2070, which was that double top in April-May
  • Next key support level is 1915, 1900, 1880, then & really strong support at 1825
  • If it does drop to 1825, that would likely trigger several new BUY alerts

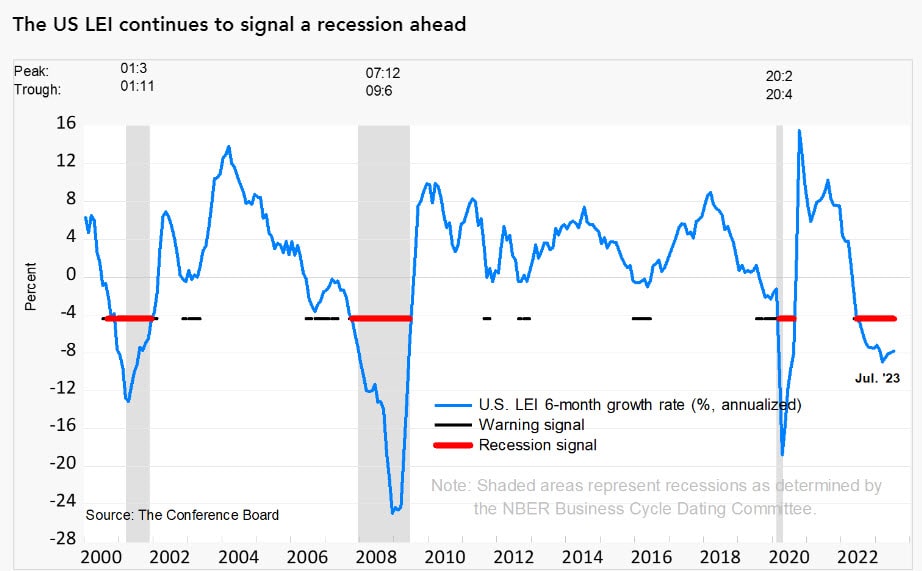
In Martin’s interview with Jim Goddard, he explained why he still feels a recession is very possible. He outlined the two key leading indicators, the inverted yield curve and the Conference Board’s Leading Economic Index (LEI).  Both of these have an almost perfect record in forecasting recessions. Both are forecasting a recession coming soon.

A yield curve is inverted when short-term yields are higher than long-term yields. An inverted yield curve is a leading indicator of a recession and since 1955 (68 years), there has been only one time where the yield curve inverted without there being a recession.Recently, the yield curve is the most inverted it has been in over 40 years. Recessions don’t start when the yield curve inverts, but rather when it starts to ‘uninvert’ (red arrows).

This chart clearly shows that for each of the last 6 recessions, they all started after the yield started to rise. Today, the yield curve is starting to ’uninvert’ (circle).

The other indicator with a near perfect record of forecasting a recession is the Conference Board’s Leading Economic Index, which looks at 10 components across the US economy. That index, again in its latest report last week, is firmly saying a recession is coming.
 

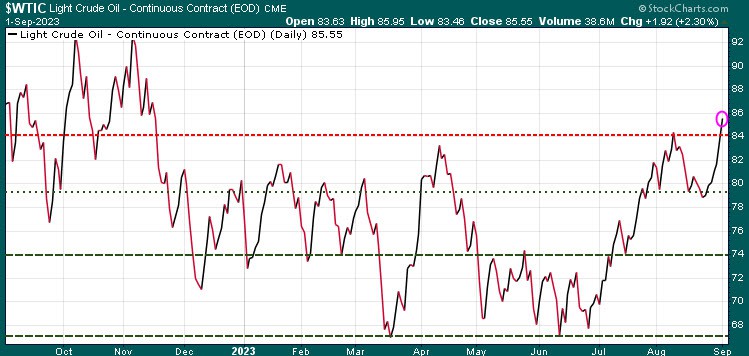
Oil has had a great week after dropping down to the 80.00 level, it has rallied big time this week, and closed Friday at 85.55.  The big bump this week came after a massive 11.5 million barrel drawdown in US crude inventories. Also, we have the Saudi Arabia production falling and they, plus potentially Russia, are expected to extend the production cuts into the end of October.
Stay tuned!

We are offering discounted prices for our three services and with each new subscription this week, we will donate $100 to Special Olympics.  See Special Offers below.

 Trend Letter:
Since start-up in 2002 Trend Letter has provided investors with a great track record, giving exceptionally accurate information about where the markets are going, and it has explained in clear, concise language the reasons why. Using unique and comprehensive tools, Trend Letter gives investors a true edge in understanding current market conditions and shows investors how to generate and retain wealth in today’s climate of extreme market volatility.

A weekly publication covering global bonds, currencies, equities, commodities, & precious metals. Publishes every Sunday evening, covers equites, currencies, precious metals, commodities, and bonds. Each weekly issue is about 50 pages, mostly charts, with key bullet points to make easy to understand. A 10-15 min read

Timer Digest says“Trend Letter has been a Timer Digest top performer in our Bond and Gold categories, along with competitive performance for the intermediate-term Stock category.”


Technical Trader:
Trend Technical Trader (TTT) is a premier hedging service, designed to profit in both up and down markets.

Our hedging strategy empowered  TTT subscribers to not only protect wealth from serious losses during markets crashes, it allowed them to be positioned to make significant gains as markets crashed.

TTT isn’t just a hedging service.  Its timing strategies have returned fantastic gains on the long side. See examples here

Included is our proprietary Gold Technical Indicator (GTI).


Trend Disruptors:
Disruptive technology trends will propel our future and the reality is that no industry will go untouched by this digital transformation. At the root of this transformation is the blurring of boundaries between the physical and virtual worlds. As digital business integrates these worlds through emerging and strategic technologies, entirely new business models are created.

Trend Disruptors is a service for investors seeking to invest in advanced, often unproven technology stocks on the cheap, with the objective to sell them when masses finally catch on. Covering Artificial Intelligence (AI), Virtual Reality (VR), Augmented Reality (AR), 5G, Quantum Computing & many more.

All subscriptions in $US

Special Offers

ServiceRegular PriceSpecial PriceSavingSubscribe
Trend Letter$599.95$349.95$250Trend Letter $349.95
Technical Trader$649.95$349.95$300 Trend Technical Trader $349.95
Trend Disruptors$599.95$349.95$250 Trend Disruptors $349.95
Better Deals
Trend Letter + Technical Trader$1,249.90$549.95$699.95 Trend Letter & Technical Trader $549.95
Trend Letter + Trend Disruptors$1,199.90$549.95$649.95 Trend Letter & Trend Disruptors $549.95
Technical Trader + Trend Disruptors$1,249.90$549.95$699.95 Technical Trader & Trend Disruptors $549.95
Best Deal
Trend Suite: Trend Letter + Technical Trader + Trend Disruptors$1,849.85$649.95$1,199.90 Trend Suite: TL + TTT + TD $649.95
Market Notes

Market Notes – June 13/22

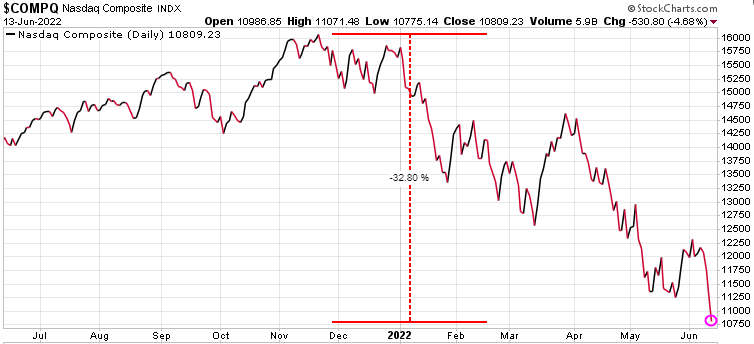
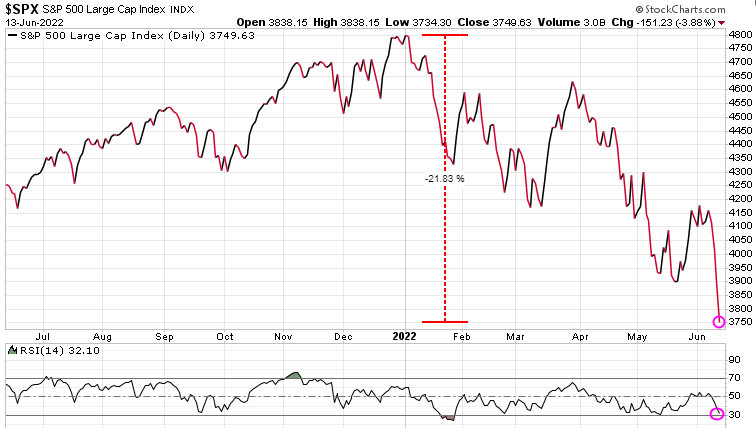
The S&P 500 dropped back into a bear market within the first 30 minutes of trading today. The index is now down over 20% from its January high, marking the lowest level since March 2021. The Dow plummeted 2.79% while the Nasdaq fell 4.8%. Recession fears are growing amid crippling inflation and people are pulling out of their positions before the situation worsens.

For the last six months we have warned that in bear markets, relief rallies typical fail to make new highs and in fact tend to make new lows.  Our Trend Letter and especially our Trend Technical Trader (TTT) services have been using hedging strategies to protect our portfolios from these violent bear markets and even to profit from them.

Bear markets typically have three phases. The first stage is a sharp decline, followed by a rebound, and then a drawn-out fundamental downtrend. This is likely where we are now and we are likely to see some strong relief rallies, followed by deep corrections.

If you have yet to put any hedging strategies in place, we should be due for a rally very soon, which would be an opportunity to put in such a strategy.  If you need assistance on how to hedge, seriously think about subscribing to TTT at a 50% discount. Click here to subscribe.

The Nasdaq representing the tech stocks is now down over 32% since its high in November.

The S&P 500 is now officially in a bear market, having dropped over 21% since its high at the start of January.

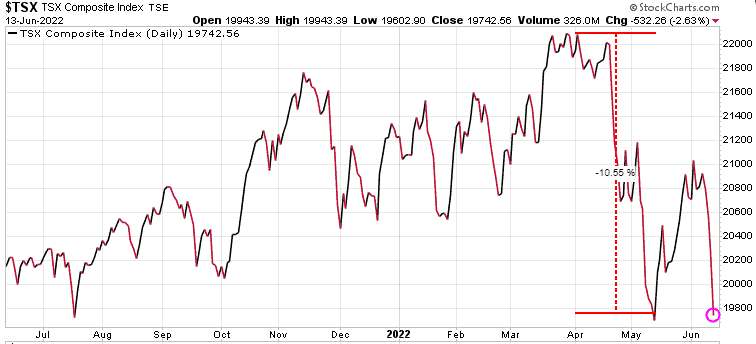
The Canadian TSX has fared much better thanks to energy sector. The TSX is down ~10% and has not yet hit new lows.

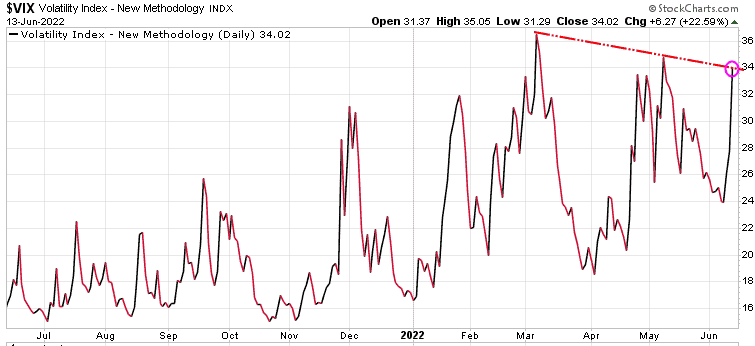
Volatility spiked over 22% today.

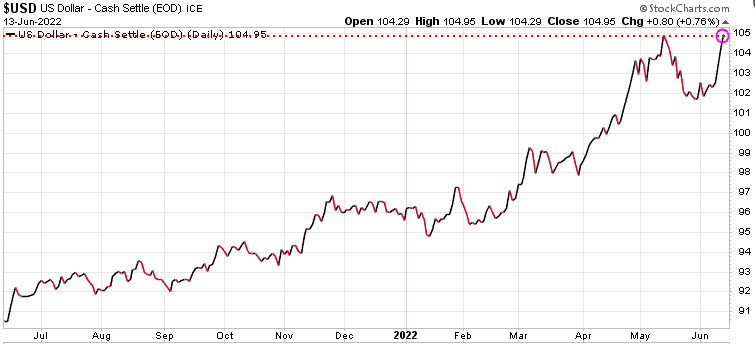
The $US continues to be a safe-haven play in this bear market, testing recent high.

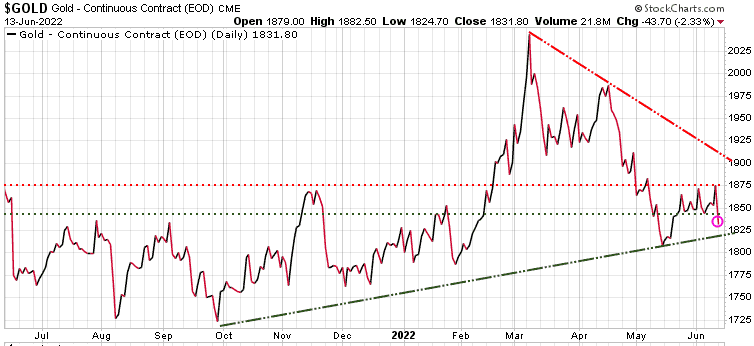
On Friday Gold jumped along with the $US as a safe-haven play. Today it fell off – very inconsistent and frustrating!

Stay tuned!


Market Notes

Market Notes – April 28/22

US stocks ended sharply higher Thursday, led by technology shares as markets continued a comeback from steep losses earlier this week. This gain was in spite of the news that the US economy   unexpectedly contracted at the start of 2022 for the first time in nearly two years as lingering supply chain imbalances, inflationary pressures, and war in Eastern Europe weighed on growth. First-quarter US gross domestic product (GDP) fell at a 1.4% annualized rate after a 6.9% pace of growth at the end of 2021.

The bad news is good news logic here is that the Fed will be less likely to aggressively raise rates if the economy is heading toward a recession.  The other spark for the markets was the anticipation for Apple’s earnings, which came in positive after the close.


As we highlighted in Tuesday’s Today’s Charts, investor sentiment had gotten very negative (bearish) and suggested that we would see a relief rally.  Right on schedule, starting Wednesday we saw the markets rally, and then today had a gonzo spike.

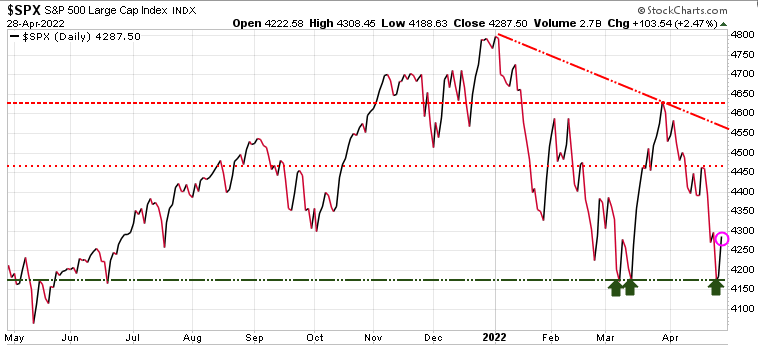
The key support for the S&P 500 was the 4173 level which held the previous two times it was tested (green arrows). It held again this week, which triggered this relief rally which should test near-term resistance at 4465 (light red dashed horizontal line). If it can push through that level, then the next resistance is 4630 (next red dashed horizontal line).

The S&P 500 has seen a series of lower highs and lower lows, so until it breaks out of that trend we need to be cautious here. The 4173 remains near-term support and if that level gets taken out, then we are in for a deeper correction, potentially much deeper.

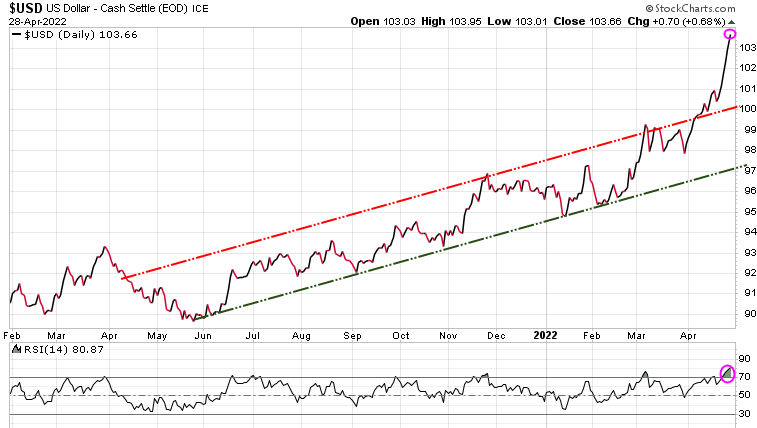
The US dollar has been on a parabolic tear this year. With Exchange Traded Funds (ETFs) it is very easy to trade currencies, just as easy as trading any stock. Unfortunately, most investors miss these opportunities.  Trend Letter uses these ETFs and currently has a leveraged short Euro trade that is up over 32% right now.

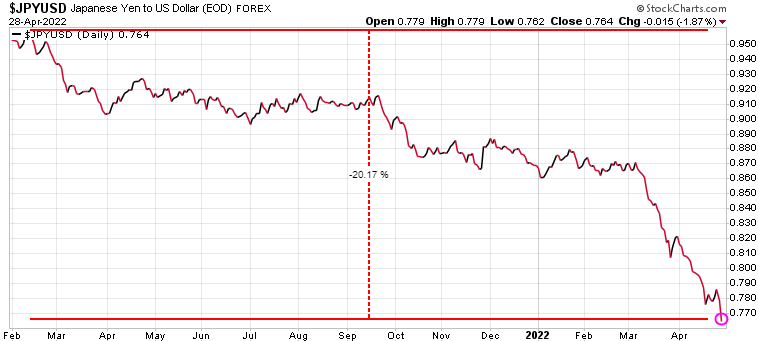
The Japanese 10-year bond yield has been negative until just recently, and even today only pays 0.21%. The US yield is 2.82% (Canada is 2.78%), so Japanese investors are pouring into US bonds, meaning they are converting Yen for $US. As a result, the Yen is getting hammered, down over 20% this year.  A weak Yen drives up import costs, especially energy and food.

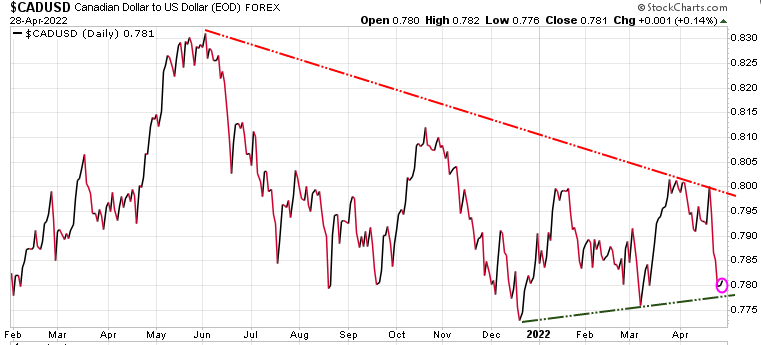
After hitting .83 in early June thanks to energy and commodities, the Loonie has not been able to maintain that strength due to the massive strength in the US.

Stay tuned!