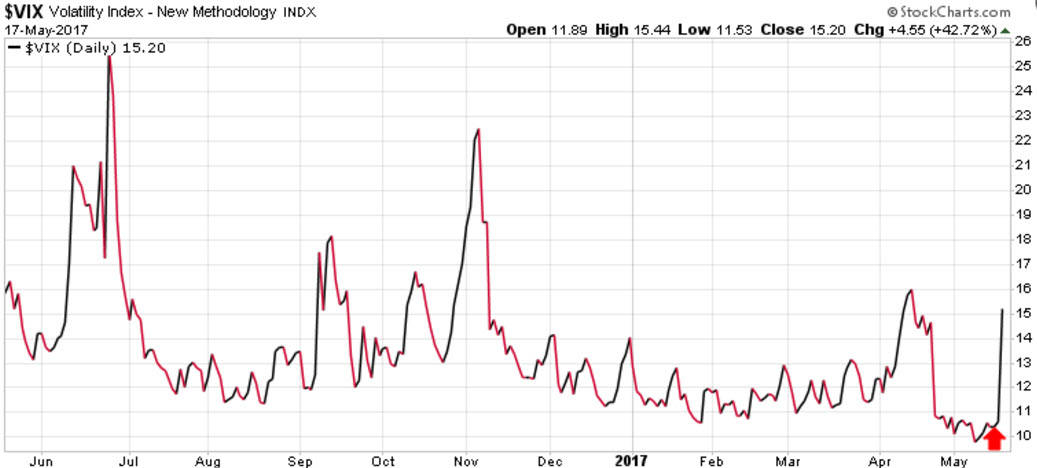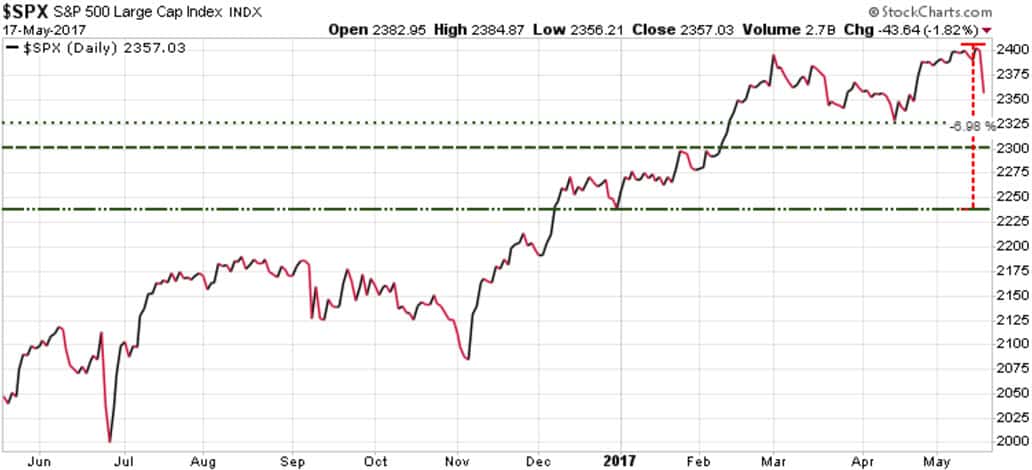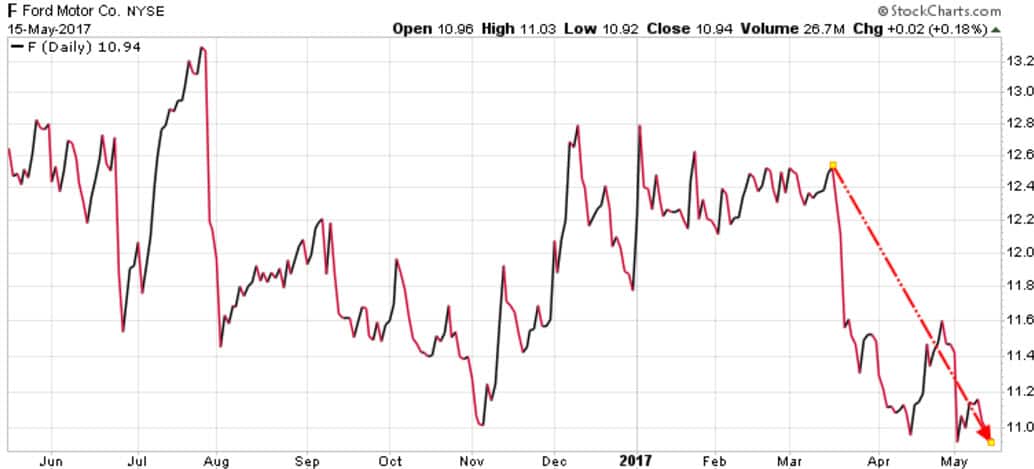
A glorious day in stocks resulted in the worst tumble in over 8 months. This was very long overdue and had nothing to do with U.S. politics. Hopefully it’s the start of a lasting trend, however for now we’ll call it a good start.
All our positions were up today with the exception of TBT. Most notably, VXX rose 18% today alone.
As good a start as that is, a bear market has not necessarily begun. Reasonable expectations remain that markets make a new all-time high, possibly with non-confirmations among major indexes, then a protracted market drop will finally commence. This may have already occurred with the NASDAQ and S&P500 again marking new all-time highs this week while the DJIA has not done so since early March.
In any case, an enduring and deep bear market looms and it’s safer to be short in the current technical and fundamental environment.
Open Positions
VXX – opened at $14.60 on May 11 Initial sell stop at $13.20 on an intraday basis.
HXD – opened on May 04 at $6.70 Initial sell stop at $6.30 on an intraday basis.
RJA – opened at $6.35 on May 02 Initial stop level at $5.84 on an intraday basis.
WEAT – opened at $7.10 on May 01 Initial stop at $6.55 on an intraday basis.
FXB – opened at $120.54 on March 16 Initial stop at $120 on an intraday basis.
NIB – opened at $24.00 on February 15. No stop on this position as we intend to own it until cocoa is above $2500.
NIB (2nd position) – opened at $23.63 on May 08 No stop on this position as we intend to own it until cocoa is above $2500, however if you have both positions and wish to limit risk on at least one then we suggest a sell stop at $20.90
DGP – opened at $25.87 on November 02. No stop until GTI turns bearish.
SJB (1st position) – opened at $25.15 on October 28. Initial stop at $23.58 Original post is here.
SJB (2nd position) – opened at $24.95 on December 14. Initial stop at $23.58
SJB (3rd position) – opened at $24.40 on March 08. Initial stop at $23.58
TBT opened at $30.80 on July 12 2016. Initial stop at $29.90. Here’s the original rationale and chart.
Indicators
GTI (Gold Trend Indicator) : Bullish
DJIA: 20606 -372 Wednesday.
Daily: bearish, 20890. Short-term highly aggressive traders and hedgers may wish to be net long when the DJIA is above this level, and net short below.
Weekly: bullish, 20845. Moderately aggressive investors, trading or hedging on an intermediate basis, who follow the Weekly Indicator may find it prudent to be hedged or net short if the DJIA is trading below this pivot level. Reminder – we do not have an official change to “bullish” or “bearish” unless the DJIA closes the calendar week above/below this pivot level as the case may be.
Monthly: bullish, 20400. Conservative investors, trading or hedging on a longer-term basis, who follow the Monthly Indicator may find it prudent to be hedged or net short when the DJIA is trading below this pivot level. Reminder – we do not have an official change to “bullish” or “bearish” unless the DJIA closes the calendar month above/below this pivot level as the case may be.
NOTE : Speculators and frequent traders will prefer to use the Daily or Weekly Indicator levels as trading or hedging pivot points, while longer-term investors may prefer to consider only the Monthly Indicator level.
General Recap
As of March measures, U.S. investors were holding 52% stocks relative to cash. In nearly 30 years, fewer than 10% of months have shown measures as high as 52% in the stocks-to-cash ratio. Most of those months were toward the end of the massive market top of the late 1990s.
U.S. Margin debt is 38% higher than at the market peak of July 2007 and 90% higher than the market top in March 2000.
As of early February 2017 the Investment Intelligence Advisors’ Survey has registered a bullish percentage that shows the highest level of optimism in 30 years. That’s extremely bearish, and the last time this reading was higher was in 1987 before the major market crash that year.
Here’s a look at the Shiller 10-year price/earnings ratio as of late January 2017. The implications are self-evident and ominous.

Complacency and imprudence is not rewarded in the long term. Whenever the top is hit the gains in 2017, at least, will be unwound in a matter of days or weeks.
Consider too that a lasting bear market hasn’t happened in decades. The crash of 2000-2003 was fully reversed by 2006 and the DJIA was at all-time highs by 2007. The crash of 2007-2009 was fully reversed by 2012 and by the end of 2016 the DJIA was at a far higher all-time high. We may well be approaching a lasting top in equities before a real, and long, bear market. Act accordingly with respect to risk, position sizing and stops. Anything you buy, be prepared to buy again (or sell) at half the price or less. Always.
Risk is very high. A material and lasting correction in equities is years overdue, while some bullish measures are at extremes not seen since the peak of the tech bubble in the late 1990’s.
In the “big picture” it’s not a safe time to enter long-term holdings which is why the only longs we’d considered keeping at least paid high dividends.
One well-timed entry can be far more profitable than rushing into a dozen positions simply to be doing something, so those with a long-term outlook are best advised to wait for a significant market low even if it takes months or years, or at least get paid dividends while waiting.
The old adage applies – “If in doubt stay out”, and wait for new opportunities as they come up.
Prudent position sizing and risk management are key. Without risk however there can be no reward, so over time we’ll seek to mitigate risk via true diversification and buying only when shares seem beaten down and oversold, as well as adopting general market short positions at prudent times in order to hedge.
Positions Closed in 2017
FXB – opened at $120.25 on October 11, stopped at $118 on January 11
FXP – opened at $30.10 on October 11, stopped at $29.90 on January 26.
NIB – opened at $27.70 on January 24. stopped at $24.90 on February 08.
TZA – opened at $19.85 on December 22, closed at $18.35 on February 10.
ETP – opened at $35.61 on December 03 2015, closed at $38.20 on February 10 and yielded 11.9% ($4.22) based on our entry price for 14 months.
EARN – opened at $12.34 on December 17 2015, closed at $14.10 on March 08 and yielded 13% ($2.10) based on our entry price for over 15 months.
OSP.to – opened at $7.00 on March 01, closed at $9.33 on March 08 and yielded 17.1% ($1.20) based on our entry price for 12 months.
ONCS – opened at $1.67 on February 22, closed at $1.29 on March 14.
VXX – opened at $18.00 on February 16, closed at $15.80 on March 17.
USLV – opened at $11.95 on December 29, closed at $15.90 on April 07.
WEAT – opened at $7.30 on January 17, closed at $6.65 on April 21.
SDOW – opened at $33.85 on March 06, closed at $33.76 on April 25.
TZA – opened at $17.85 on February 23, closed ay $16.89 on April 25.
VXX – opened at $16.30 on March 21, closed at $15.14 on April 25.
Average +7.2% over 19 weeks including dividends (19.7% annualized)
Win percentage 29%
Average Gain 33.6% including dividends
Average Loss 7.5%
Click here for the tally of closed positions in 2016 representing annualized gains of 40%
