Target levels for Year-end for the S&P 500
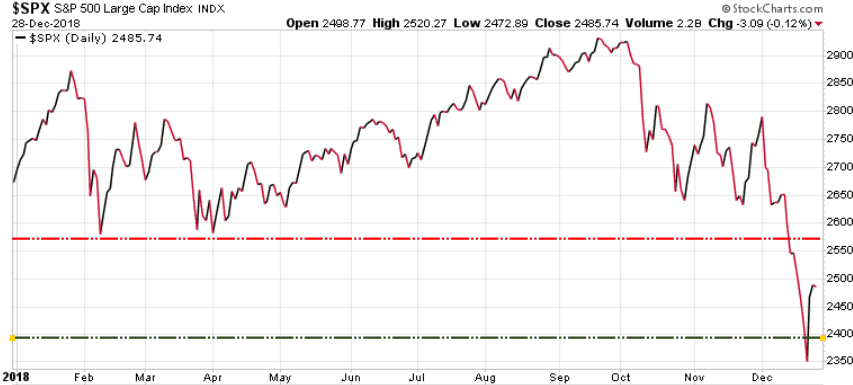
In Wednesday’s blog after the S&P 500 soared a record 116.60 points or 4.86%, we warned “be careful here, we are not out of the woods yet!” Monday is year-end and here are our key targets for a Monday close:
Friday’s close was 2485.74
2575 – a Monday closing below this resistance level (top red line) suggests that this recent rally will be short-lived and a re-test of 2400 is likely.
2395 – a closing below this support level (lower green line) suggests a steep correction is possible.

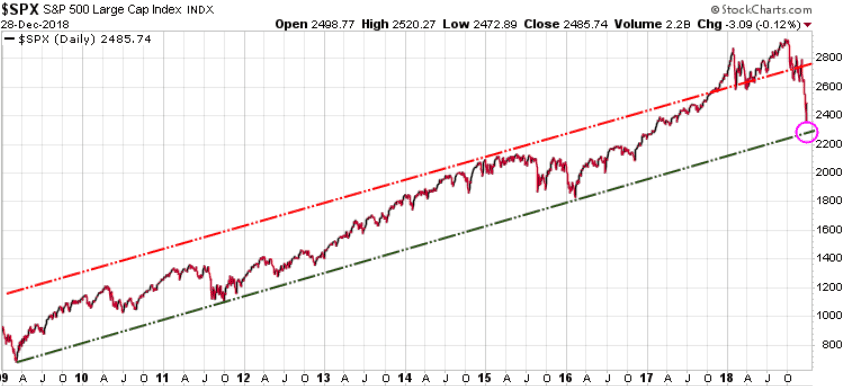
In the bigger picture we need to see a break down below its 9+ year uptrend channel to open the door for a steep correction.

An incredibly reliable leading indicator that has an incredible record identifying stock market tops:
We show this indicator to our subscribers often as it is a key leading indicator. You have probably heard the term ‘inverted yield curve’ but likely do not know how reliable it is at warning of a coming recession and stock market top. The yield curve we are referring to is the spread between the yield on the 10-year government bond vs the yield on the 2-year bond. These yields tend to move for different reasons, with the longer-term 10-year yields moving based on the market, while the shorter-term two-year yields move largely due to the actions of the Federal Reserve.
Typically, long-term rates are higher as investors demand higher payments due to the risk of lending their money for a long time, which makes sense. But this last year the Fed has been hiking rates, which has pushed up the yield on the 2-year bonds faster than the yields have risen on long-term bonds.
Below is the current chart of the spread between the 10-year yield and the 2-year yield. We have marked with red circles each time since 1988 where the yield curve has inverted, meaning that the short-term 2-year bond had a higher yield than the longer-term 10-year bond. The key is that every time this has happened, between 12-18 months later the stock market topped and then reversed, heading much lower. As we can see on the right hand side of this chart, the yield curve is not yet inverted, but it is very close, just .18% points away. But remember this is a leading indicator, meaning that even if it inverts next week, we should have between 12-18 months before the stock market top is in.

That doesn’t mean we won’t see more volatility like we are experiencing now, it just means we are not likely to see the final top for a while yet.
There will be a full update for subscribers in this weekend’s issue of the Trend Letter.
Stay tuned!


