Two indicators showing stock market is overbought

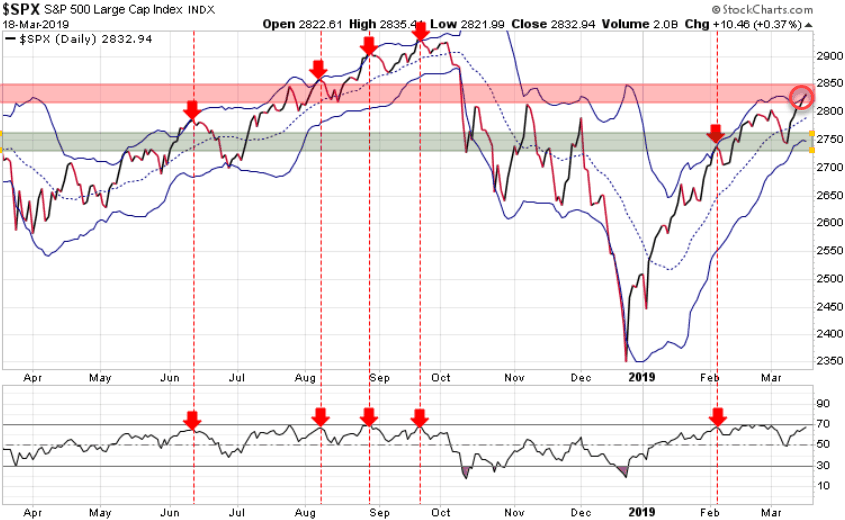
The S&P 500 is attempting to break through its key near-term resistance range but as of today it is also getting overbought. While we remain long-term bullish for the equity markets, we note that two key technical indicators are signaling that the stock market is getting overbought in the near-term. On the chart below we show how the Bollinger Bands (set of blue wavy lines) and the Relative Strength Index (lower chart) are very close to signalling the market is overbought. As highlighted by the red arrows, when we get both the Bollinger Bands and the RSI are indicating an overbought status, we typically see a pullback. This does not mean the high is in, but it does warn that we should see a pullback soon.
The red shaded area has been our model’s near-term target high for the S&P so the timing here would fit our model’s call for a pullback in March. The green shaded area was the previous resistance range and is now the near-term support level.

The US Fed is having its FOMC meeting Tuesday and Wednesday and the market is expecting to hear Fed chair Powell step up to the microphone on Wednesday and say they are going to “wait and see,” meaning they will wait to see how the economic data evolves before making any interest rate decisions. Any message suggesting a potential rate hike would spook the market.
Stay tuned!
