Why should I care if the yield curve inverts?
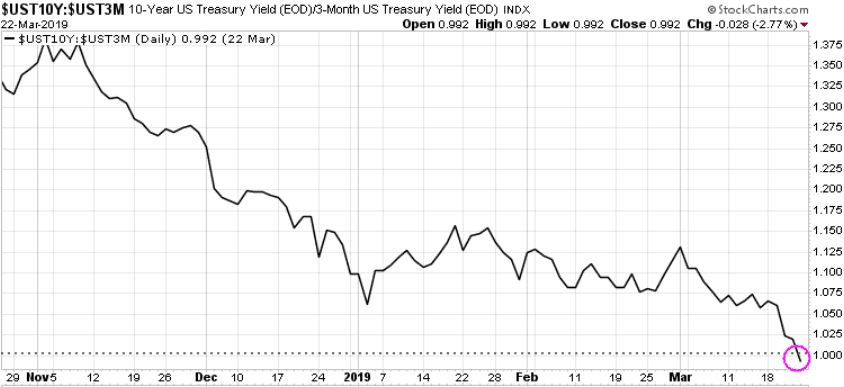
On Wednesday last week the US Federal Reserve announced the expected, saying they were not raising rates at this time. Voting members also changed their outlook for 2019 from the two increases predicted in December to no movement. At first the stock market loved the news, but as the day went on investors started to digest why the Fed was not raising rates – a slowing global economy. Then on Friday we got the news that the 10 year/3 month yield curve had inverted.
What is the yield curve?
The yield curve is a way to show the difference in the compensation investors are getting for choosing to buy shorter – or longer-term debt. Typically an investor would expect more return for lending their money for longer periods, with the greater uncertainty that brings. So yield curves usually slope upward.
A yield curve goes flat when the premium, or spread, for longer-term bonds drops to zero – when, for example, the rate on 30-year bonds is no different than the rate on two-year notes. If the spread turns negative, the curve is considered “inverted.”
Why should I care?
The yield curve generally reflects the market’s assessment of the economy, especially related to inflation. If investors believe inflation will increase they will demand higher yields to offset its effect. Given that inflation usually comes from strong economic growth, a sharply upward-sloping yield curve generally means that investors have bullish (positive) expectations. An inverted yield curve, by contrast, has been a reliable indicator of impending economic slowdowns, often alerting to a coming stock market top and recession, like we saw in 2007. Every recession has been preceded by an inverted yield curve.
Last week we saw the 10-year/3-month yield curve invert which is our first official key warning of a looming stock market top and recession..

But we have not yet seen the more watched 10-year/2-year yield curve invert. When we see the 10/2 year invert then the clock will start ticking to a stock market top and a recession. On January 24th we posted a blog on how an inverted yield curve and a top in the Confidence Board Leading Economic Indicator (LEI) are great tools to alert us to a looming stock market top.
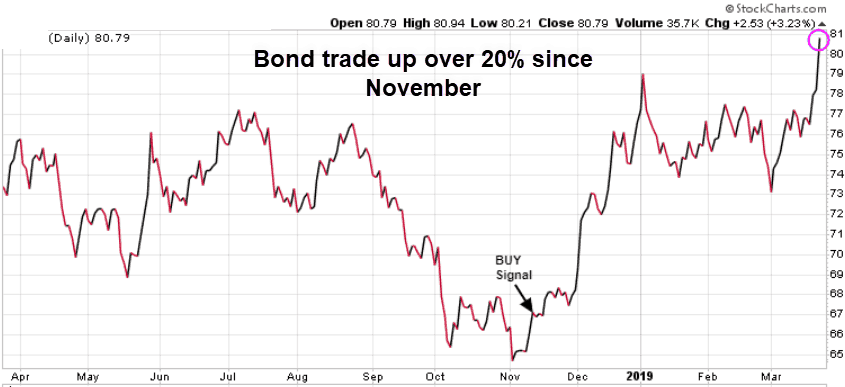
Luckily for our subscribers, back in November, while the mainstream media was calling for a steep bond market sell-off, our models projected that we would see a significant short-term bond rally. On November 12/18 we entered a trade using an Exchange Traded Fund (ETF) and that trade is up over 20% in just over 4 months. Make no mistake, long-term we will see the bond market sell-off, but according to our models that scenario is a ways off.

Stay tuned!

