S&P 500 hits TL Model target, is it time to buy?
Here is the update of how the S&P 500 has performed compared to our Weekly TL Forecaster Model for the S&P 500 since April 26th.
Note that our model (gold line) tends to lead the markets.
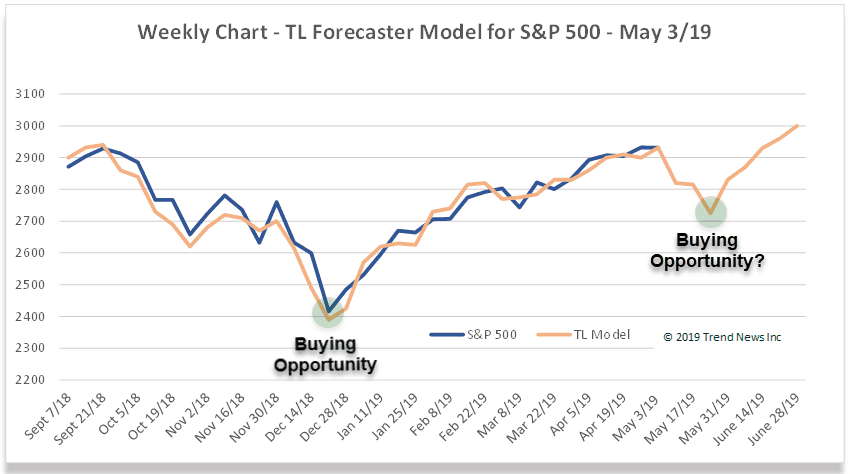
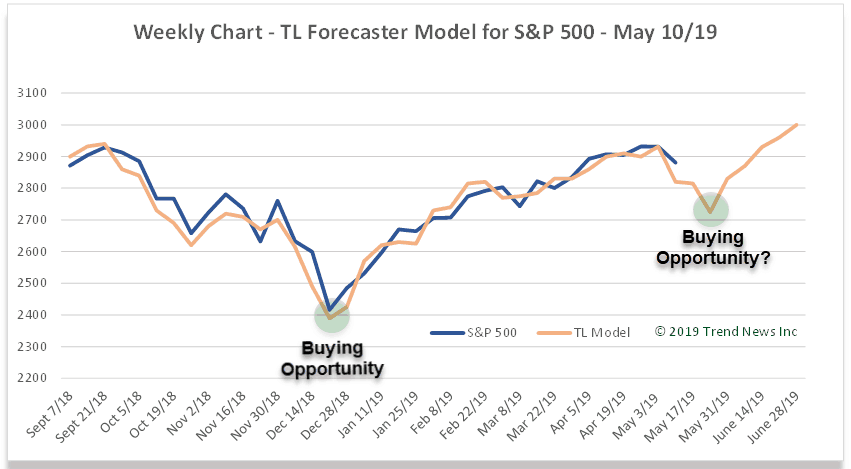
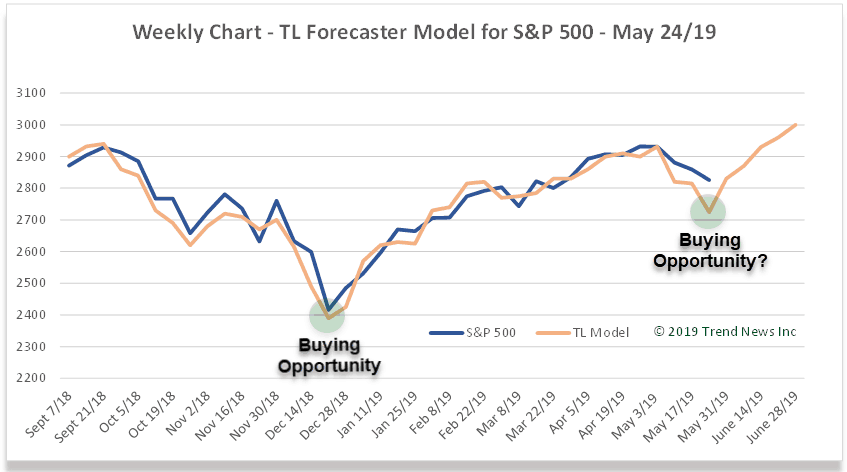
It projected the current decline and forecast a bottom in late May at the low 2700 (2750-2725) range. Check out how the market has eerily tracked the TL Model projection.
We will be looking to send Trend Letter subscribers fresh new BUY Signals if that low 2700 support level holds. Note: If that 2700 level does not hold, then we could be in for a much bigger correction.
On Friday, the S&P 500 closed at 2752, within a hair of the TL projection low of 2750-2725.
Projection vs actual as of April 26/19:

Projection vs actual as of May 3/19:

Projection vs actual as of May 10/19:

Projection vs actual as of May 17/19:

Projection vs actual as of May 24/19:

Projection vs actual as of May 31/19:

The S&P 500 has now touched the upper range of our model’s target low, exactly on the last day of May, and is now approaching our next target ‘Buying Opportunity’. Investor sentiment as measured by the CNN Fear & Greed Index is now at an ‘Extreme Fear’ reading, which for contrarian investors is a positive sign. Is it time to buy?
Every Sunday Trend Letter subscribers get our model’s latest readings on stocks, bonds, currencies, commodities, and precious metals, with our model’s latest BUY & SELL triggers. If you want to join our list of global subscribers and receive these very timely and accurate projections, we are offering a $200 discount, meaning you would only pay $399.95. This offer is valid for the next 3-days only! Click Button below to subscribe to this Special Offer.
Stay tuned!

