Money Talks Charts
Martin was the guest on the Money Talks podcast on Saturday, and in the interview he gave their listeners two ‘off the grid’ stock picks. Below are the notes along with some charts from that interview. Some of the charts were updated on 09/05/21. If you wish to hear the interview click here. It starts around the 14:30 mark.
Equities
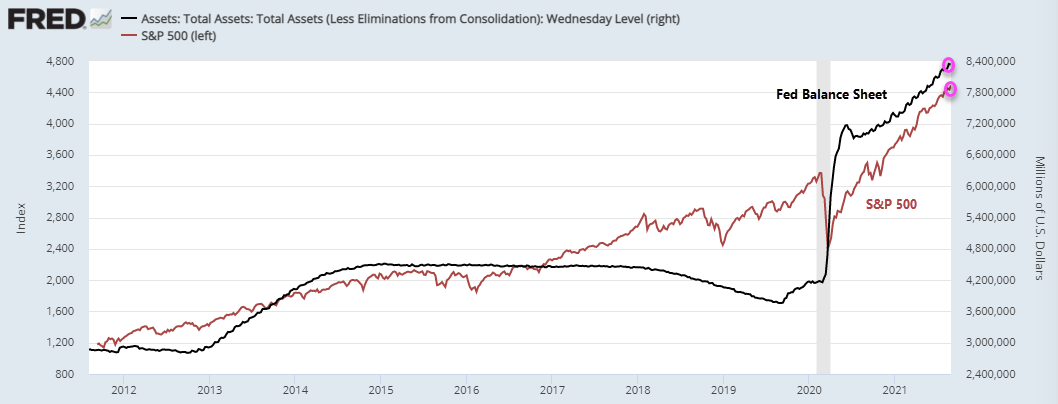
Key contributors to the strong move in stocks has been the pumping of liquidity from the central banks. The correlation between the rise in the Fed balance sheet and the S&P 500, especially since the pandemic from last March, is striking. The markets are addicted to central banks buying up bonds and mortgage backed-securities, and keeping interest rates artificially low.
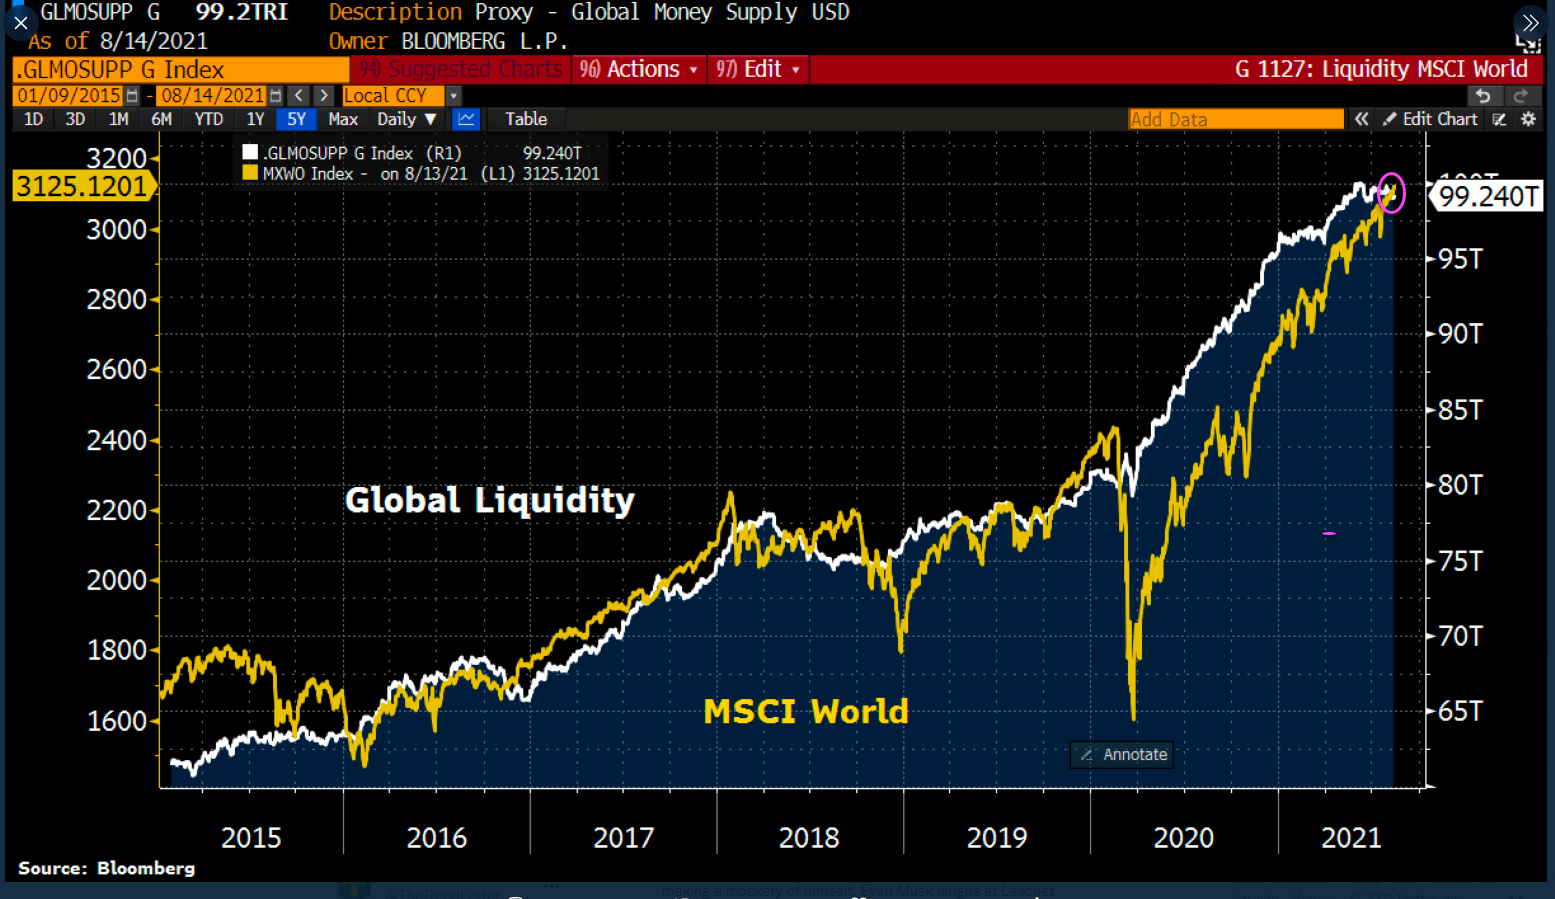
And it is not just in North America that we see this parallel between central bank balance sheets and the stock markets. The global liquidity and the MSCI World Index are in lock step. It is almost a game of musical chairs, if central banks keep pumping out the liquidity, markets keep moving higher
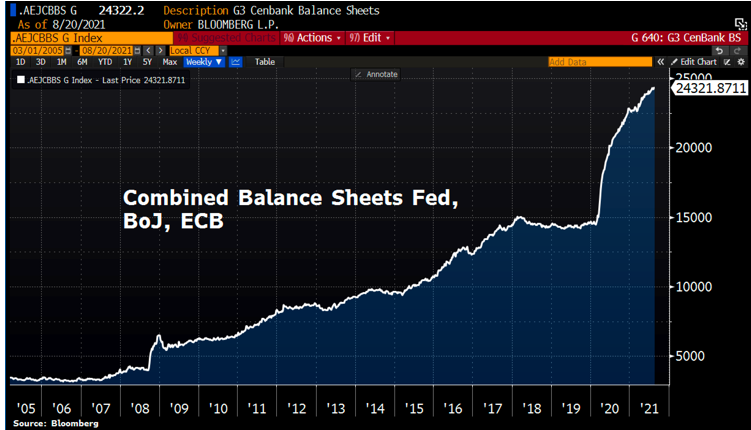
The combined Balance Sheets of the Fed, ECB & BoJ is at a new record high of $24.3 trillion!!!
This reliance on central banks to support the equity markets has created a ‘good is bad’ and ‘bad is good’ scenario. If we get good economic news, investors panic, worrying that the Fed and other central banks will start to put the breaks on their purchases (‘taper’ ), which they feel will hurt stocks, especially Tech stocks. On the other hand, when we get negative economic data, investors feel some relief that without the risk of inflation, central banks will continue pump out liquidity.
Another factor pushing stocks higher have been stock buybacks. Goldman Sachs expects a whopping $720 billion in stock buybacks before the end of the year.
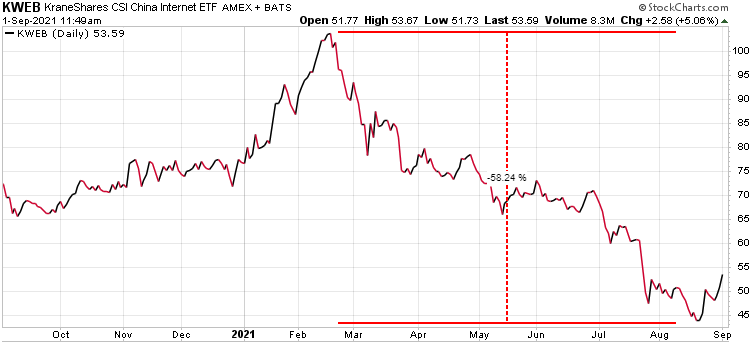
On the other end of the scale we have the Chinese government’ aggressive crackdown on successful Chinese companies, especially tech stocks
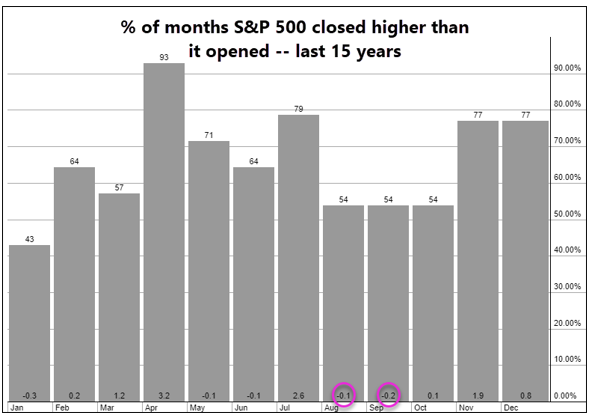
Historically, August and September are the weakest months for the equity markets, but clearly this year, August has been anything bust weak, closing the month up 2.9%. We will see if now that the traders are back at their desks if history prevails and we see the markets decline in September.
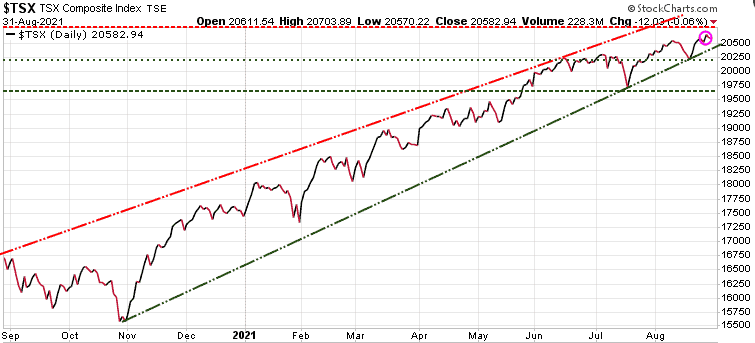
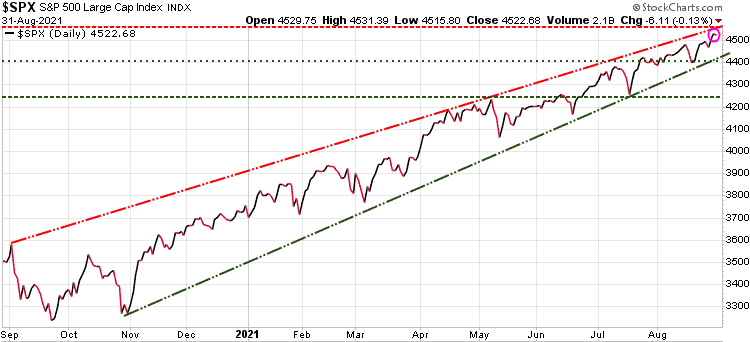
The TSX and S&P 500 both had another up month in August, the seventh straight month of gains.
Things to watch for:
- After Labour Day traders are back from vacation
- The S&P 500 has gone 209 days without even a 5% pullback, so certainly overdue
- Our models warn of a potential pull-back/correction starting next week, so investors should at the very least have a hedging or exit strategy.
- If a 10%-15% pullback would cause you to lose sleep at night, then you are likely too heavily invested.
- Our Technical Trader service was originally designed as a hedging service and provides a number of hedging strategies, along with some stellar long plays.
Bonds
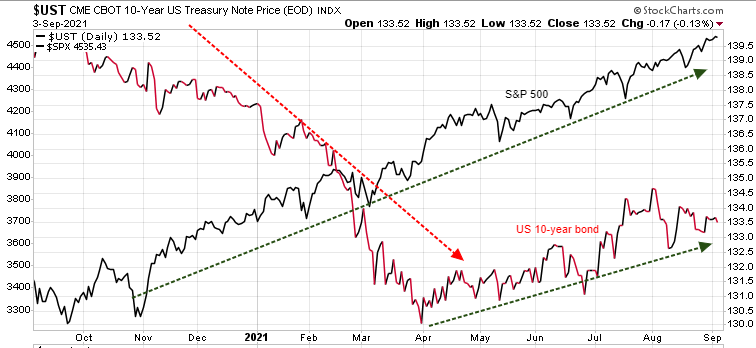
Typically, the bond market and equity market move inverse to each other. If equities are rising, bonds typically decline. That is what was happening up until April of this year, but since April, we have seen both the S&P 500 and the US 10-year bonds moving up . This suggests that one of these markets is wrong, so next week will be interesting when the traders return.
- The chart below shows the Real Return investors get from holding various gov’t bonds
- Real Return is the nominal yield minus inflation
- The only bonds on the chart giving positive real returns are Mexican, all others are negative returns
- Meaning you are losing purchasing power holding any of these gov’ bonds, except Mexican
- The worst return on the chart is Germany at -4.16%

- If you were using a traditional 60/40 stock/bond portfolio, the bond portion will kill your return, as the interest won’t come close to keeping up with inflation. Instead of being a safe investment …it’s the opposite of safe.
- The bonds are going to drain your retirement account and purchasing power
Gold
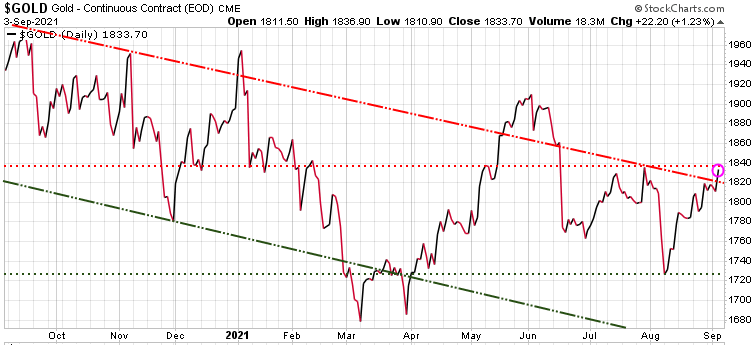
- Gold has been in a downtrend channel for year, since last August, & is just now breaking out of that channel
- Gold was up about $20 to close the week, so we will see if it can gains some traction here
- The $US continues to have a big say on what happens to gold & silver
- $US strength hurts the precious metals, while dollar declines give gold a boost
- Near-term Resistance sits at 1848, 1925, then 1950…a move above 1950 would suggest gold could take a run at its its intra-day high of 2081
- Near-term Support sits at 1760, 1695 then 1670…a drop below 1670 would be very bearish for gold
Oil
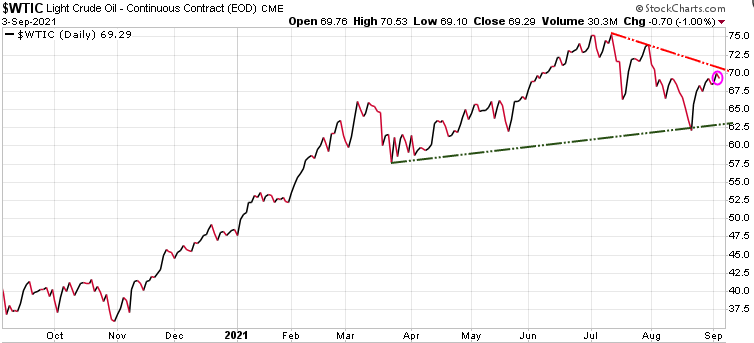
- Looking for oil to decline after the driving season is over
- Potential for sub $50
Stock Picks:
We have two trade ideas; one from our Trend Disruptors service & one from our Technical Trader service
Disruptor trade idea: Low Code Application Platforms (LCAP)
- There is a blog article on our site listeners can check out
- These are platforms that facilitate the development of complete business applications by people with little or no programming experience
- Similar to how you can now build a website by simply selecting templates that are applicable to your needs
- “low-code automation” replaces endless lines of code with intuitive images and easy-to-use commands.
- With just a few clicks, practically anyone can create and run programs to help speed up workflow.
- Companies are facing mounting challenges around application development and delivery: Shortages of skilled developers are driving up costs, and causing big delays in getting needed applications up and running
- Now instead of having large teams of highly-skilled, highly-prices program developers, companies can now have their regular staff create programs for improved product development, sales, marketing, or whatever programs are required
- Gartner Research: By 2023, over 50% of medium to large enterprises will have adopted an LCAP as one of their strategic application platforms.
- In 2018 this sector was valued at around $7.23 billion. Last year it was $13.2 billion. But by 2025 it’s projected to be $14.8 billion, a growth of 245% in the next 4 years.
The LCAP stock we are highlighting today is Appian Corp APPN.Nasdaq Buy up to 125.00. Use a SELL Stop
Speculative…Risk is MEDIUM
- Appian is the only recognized global leader across multiple enterprise technology markets, including low-code application development, digital process automation (DPA), intelligent business process management systems (iBPMS), and dynamic case management (DCM).
- Forrester Consulting study on Appian documented the following results:
- Build apps 10X faster than traditional development
- Reduce maintenance cost by 50%
- Gain superior functionality as compared to traditional development.
- Appian had a big run up last November on great revenue growth.
- We have been waiting for a good entry point and after a big pullback after being overbought, we are getting in at ~50% below those highs.
Technical Trader trade idea: Psychedelic therapies
- These therapies are for a large number of serious ailments such as PTSD, anxiety, insomnia, pain, and more.
- It’s still a very small sector that few are aware of with companies only being listed publicly as of a year ago
- Bruno and our Technical Trader team project this sector to be HUGE in the future, similar to cannabis x10 because while Cannabis is mild medicine for generally mild problems psychedelics are serious medicine for serious problems including ones that cost insurers $billions so the profit motive is massive.
- Our TTT service will be featuring many of these companies in upcoming blogs for subscribers, who will have a tremendous opportunity to be early investors in this sector
- We believe there will be some serious winners in this sector going forward
Our recommendation for today is ATAI Health Life Sciences (ATAI.Nasdaq) Recent price is 16.83, buy up to 19.00
Speculative…Risk is MEDIUM
- ATAI just completed a recent IPO and is backed by famous investor Peter Theil who was co-founder of PayPal, Palantir, Founder’s Group and the 1st outside investor in Facebook, as well as a huge proponent of psychedelic therapies.
- ATAI doubles as a bit of an ETF given it has investments in other companies in the space, most notably the other big player – Compass Pathways.
Money Talks Special Offers. Note $100 from every new subscription goes the Special Olympics
Trend Letter:
Since start-up in 2002 Trend Letter has provided investors with a great track record, giving exceptionally accurate information about where the markets are going, and it has explained in clear, concise language the reasons why. Using unique and comprehensive tools, Trend Letter gives investors a true edge in understanding current market conditions and shows investors how to generate and retain wealth in today’s climate of extreme market volatility.
A weekly publication covering global bonds, currencies, equities, commodities, & precious metals. Over the 20 years Trend Letter has been published, it has achieved an incredible average return of 65% on its closed trades.
Timer Digest says: “Trend Letter has been a Timer Digest top performer in our Bond and Gold categories, along with competitive performance for the intermediate-term Stock category.”
Technical Trader:
Trend Technical Trader (TTT) is a premier trading & hedging service, designed to profit in both up and down markets. Included is our proprietary Gold Technical Indicator (GTI).
TTT had another excellent year in 2020 averaging +27.3% per closed trade with an average holding time of 9.5 weeks, or +149% annualized overall.
Over the past 5 years TTT’s closed trades have averaged +40% annualized.
Trend Disruptors:
Disruptive technology trends will propel our future and the reality is that no industry will go untouched by this digital transformation. At the root of this transformation is the blurring of boundaries between the physical and virtual worlds. As digital business integrates these worlds through emerging and strategic technologies, entirely new business models are created.
Trend Disruptors is a service for investors seeking to invest in advanced, often unproven technology stocks on the cheap, with the objective to sell them when masses finally catch on. Covering Artificial Intelligence (AI), Virtual Reality (VR), Augmented Reality (AR), 5G, Quantum Computing & many more.
Trend Disruptors has realized average annualized gains of 178% over its 5 years of service.
Special Offers
| Service | Regular Price | Special Price | Saving | Subscribe |
|---|---|---|---|---|
| Trend Letter | $599.95 | $399.95 | $200 | |
| Technical Trader | $649.95 | $399.95 | $250 | |
| Trend Disruptors | $599.95 | $399.95 | $200 | |
| Better Deals | ||||
| Trend Letter + Technical Trader | $1249.90 | $599.95 | $649.95 | |
| Trend Letter + Trend Disruptors | $1199.90 | $599.95 | $599.95 | |
| Technical Trader + Trend Disruptors | $1249.90 | $599.95 | $649.95 | |
| Best Deal | ||||
| Trend Suite: Trend Letter + Technical Trader + Trend Disruptors | $1849.85 | $799.95 | $1,049.90 |
