Today’s charts – December 2/21
From MarketWatch…
Stocks finished higher for the first time in three sessions but for some bulls the downtrend may feel longer, amid a slide characterized at times by stomach-churning swings and white-knuckle climbs higher.
Investors have been on edge because the omicron-inspired jitters have resulted in some erosion of upward trend lines for the main stock benchmarks and bears wanted to see if another shoe would drop on Thursday to help solidify the downtrend.
“The bouncing in the markets due to incoming news has slowed, with markets led by cyclicals and the recovery trade,” wrote Rob Haworth, senior vice president and senior investment strategist, at U.S. Bank Wealth Management, in emailed comments to MarketWatch.
On Thursday, health officials confirmed another case, a Minnesota resident who had recently traveled to New York City for a convention, experienced mild symptoms and has since recovered. The new case makes it likely that further infections from omicron in the New York area.
“The hope is that Omicron is more benign than expected and any shutdowns will be limited in time and scope,” the UBS strategist wrote.
Note: Tomorrow we get the non farm payrolls, a report that tends to move markets, both up and down.
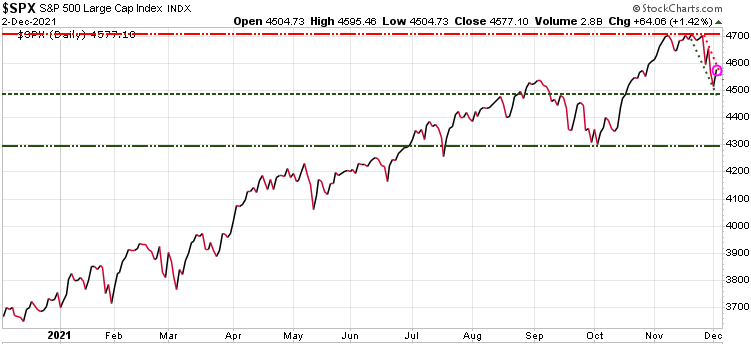
The S&P 500 briefly touched our near-term support level at 4495, but was able to bounce off that level today. If that support level does not hold, then the next support is at 4295, and a break below that level would signal a deeper correction is likely.
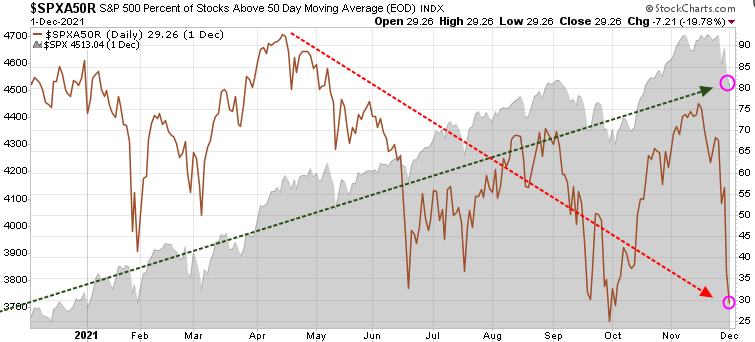
Here is an ominous chart, showing that the percent of stocks that are trading above their 50-DMA has plummeted to less than 30%. This tells us that while the S&P 500 has been in a long uptrend, the percentage of stocks participating in that bullish move has been declining since last April (red arrow).
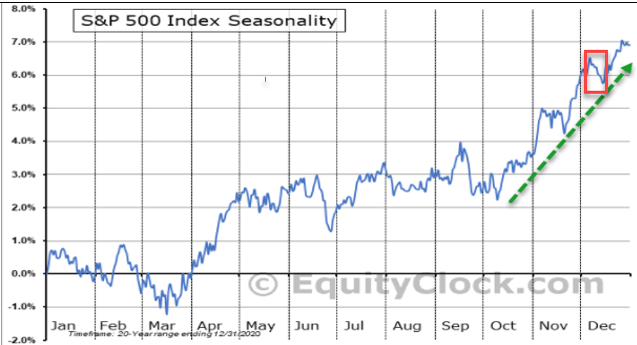
Based on seasonality, we typically get a ‘Santa Claus Rally’ from the last couple of weeks in December into early January. But all investors need to understand that we are in tax-loss selling season and that usually creates a correction in early November (red box) before the rally to end the year. .
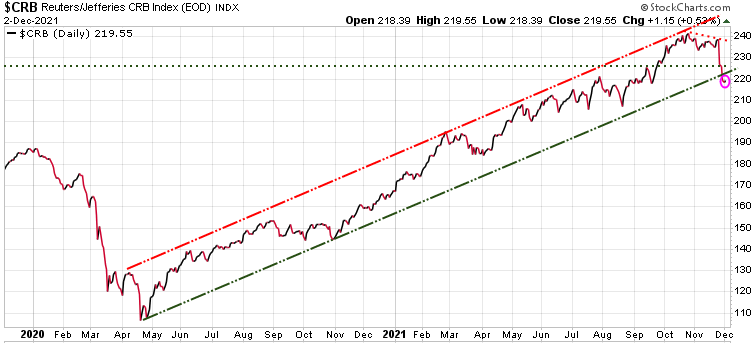
The CRB commodity index had a phenomenal run from 108 in April’20 to 243 in late October’21. But since that October high, the CRB has been rolling over with lower highs and lower lows, and then the huge gap down this past week, knocking it out of its uptrend channel.
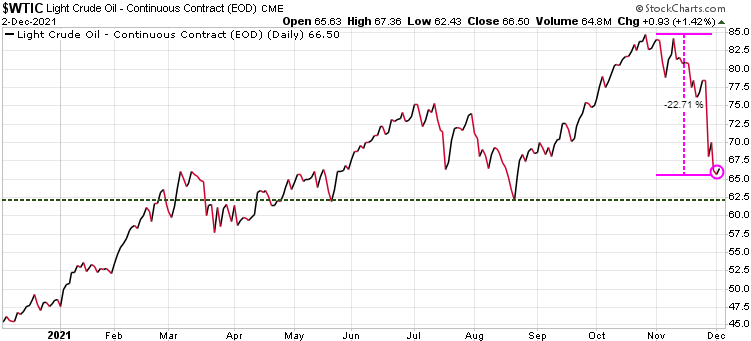
Oil was up .93 today but still down close to 23% since the high in late October.
Every Sunday evening we give subscribers full updates on equities, bonds, currencies, commodities, and precious metals. If you are not yet a subscriber, the Black Friday sale is up until this weekend, offering some excellent prices to our services.

Our Black Friday specials are up until the end of this week. See below for some great Special Offers on all our services.
Trend Letter:
Since start-up in 2002 Trend Letter has provided investors with a great track record, giving exceptionally accurate information about where the markets are going, and it has explained in clear, concise language the reasons why. Using unique and comprehensive tools, Trend Letter gives investors a true edge in understanding current market conditions and shows investors how to generate and retain wealth in today’s climate of extreme market volatility.
A weekly publication covering global bonds, currencies, equities, commodities, & precious metals. Over the 20 years Trend Letter has been published, it has achieved an incredible average return of 65% on its closed trades.
Timer Digest says: “Trend Letter has been a Timer Digest top performer in our Bond and Gold categories, along with competitive performance for the intermediate-term Stock category.”
Technical Trader:
Trend Technical Trader (TTT) is a premier trading service, designed to profit in both up and down markets. Included is our proprietary Gold Technical Indicator (GTI).
TTT had another excellent year in 2020 averaging +27.3% per closed trade with an average holding time of 9.5 weeks, or +149% annualized overall.
Over the past 5 years TTT’s closed trades have averaged +40% annualized.
Trend Disruptors:
Disruptive technology trends will propel our future and the reality is that no industry will go untouched by this digital transformation. At the root of this transformation is the blurring of boundaries between the physical and virtual worlds. As digital business integrates these worlds through emerging and strategic technologies, entirely new business models are created.
Trend Disruptors is a service for investors seeking to invest in advanced, often unproven technology stocks on the cheap, with the objective to sell them when masses finally catch on. Covering Artificial Intelligence (AI), Virtual Reality (VR), Augmented Reality (AR), 5G, Quantum Computing & many more.
Trend Disruptors has realized average annualized gains of 178% over its 3 years of service.
Special Offers
| Service | Regular Price | Special Price | Saving | Subscribe |
|---|---|---|---|---|
| Trend Letter | $599.95 | $349.95 | $250 | Trend Letter $349.95 |
| Technical Trader | $649.95 | $349.95 | $300 | Trend Technical Trader $349.95 |
| Trend Disruptors | $599.95 | $349.95 | $250 | Trend Disruptors $349.95 |
| Better Deals | ||||
| Trend Letter + Technical Trader | $1,249.90 | $549.95 | $699.95 | Trend Letter & Technical Trader $549.95 |
| Trend Letter + Trend Disruptors | $1,199.90 | $549.95 | $649.95 | Trend Letter & Trend Disruptors $549.95 |
| Technical Trader + Trend Disruptors | $1,249.90 | $549.95 | $699.95 | Technical Trader & Trend Disruptors $549.95 |
| Best Deal | ||||
| Trend Suite: Trend Letter + Technical Trader + Trend Disruptors | $1,849.85 | $649.95 | $1,199.90 | Trend Suite: TL + TTT + TD $649.95 |
.

