Market Notes – November 25/22
 See great Black Friday Specials at end of this post
Stocks finished mixed during an uneventful, shortened day of trading on Black Friday. When the closing bell rang on Friday, the S&P 500 was down 0.03%, the Dow was up 0.45%, and the Nasdaq fell 0.52%. The US stock market closed at 1:00 p.m. ET on Friday; financial markets in the US were closed on Thursday for Thanksgiving.
In the September 25th issue of the Trend Letter we said to subscribers..’The S&P 500 is oversold here, so another bear market rally is likely.‘ Since then, we have seen most equity markets in a solid rally, with the Dow Industrials leading the way.
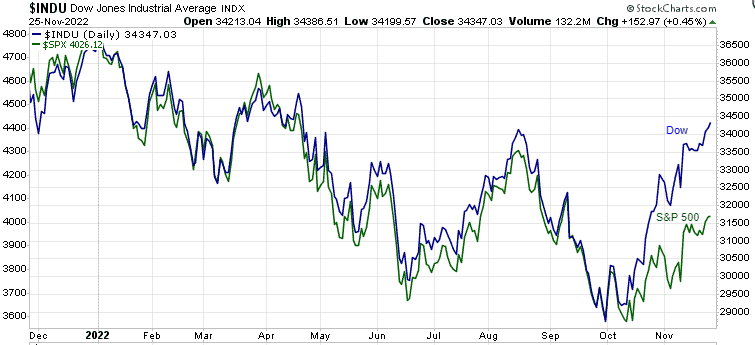
The Dow has outperformed the other indexes primarily because it is attracting foreign capital flowing into the US markets. These are primarily large Institutional investors who prefer to invest in the Blue Chip stocks. Another reason for this rally is we are now in the strongest seasonal period, where there is often a Santa Claus Rally. Is this the start of a new bull market? We doubt it.
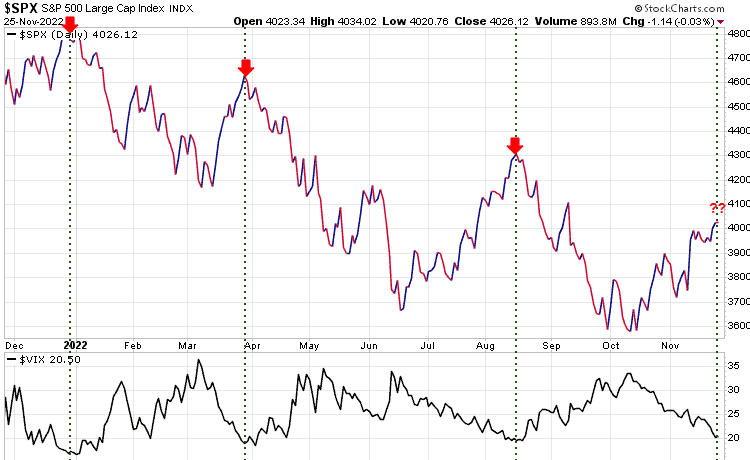
Net bullishness has been rising as investors think the ‘bottom is in.‘ As noted by the red arrows on the chart below, any reading of the VIX Volatility Index of 20 or below has provided a good signal to take profits and reduce risk. Friday, the VIX closed at 20.50, very close to that signal.
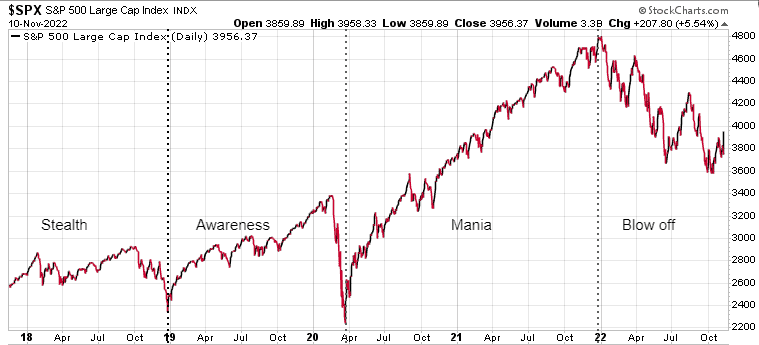
Also, we have shown our subscribers the following chart many times lately. It highlights how BEAR Markets have 4 stages or phases:
Stealth (Smart Money), Awareness (Large Speculators), Mania (retail or the masses) buy in. But after that Mania Phase we get into the Blow off Phase where the market starts to decline. A couple of key characteristics of the Blow-off phase are that we get CAPITULATION & finally DESPAIR. We have NOT seen that yet.
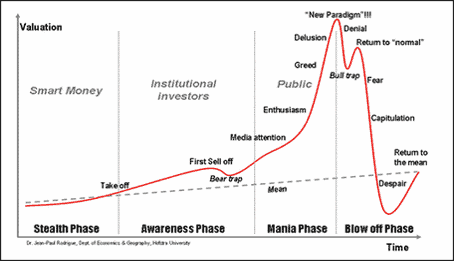
This would tell us that any rally here would be another short-term relief rally,
In early 2000 to late 2002 the Nasdaq had 8 significant rallies within its BEAR market, all over 16%…some over 40%, but still, over that period, the Nasdaq lost 75%of its value.
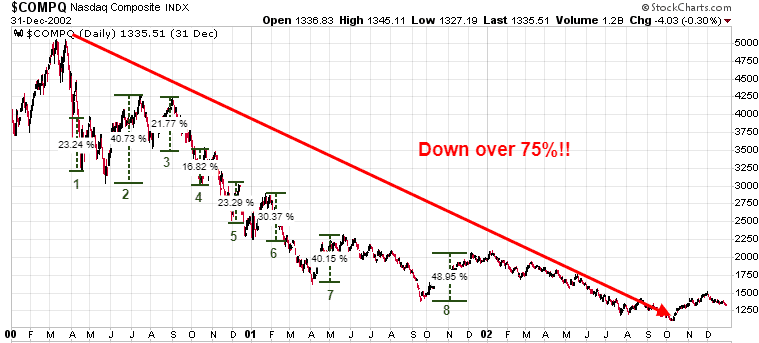
Friday, the Dow was up ~150 points, just broke through Key Resistance at the August high. We may get a Santa Claus rally, but technically the markets are getting overbought.
Are we headed for a recession?
The Fed, Bank of Canada and most other central banks have put themselves between a rock and a hard place. They are HOPING for a soft landing…to slow inflation, but not crash the economy and send it into a recession. But, while these central bankers hope for a soft landing, there are many indicators that are strongly suggesting a recession is coming. And sased on the general definition—two consecutive quarters of negative GDP—the US entered a recession in the summer of 2022.
The US Conference Board has its Leading Economic Index, which has been very accurate predicting recession.
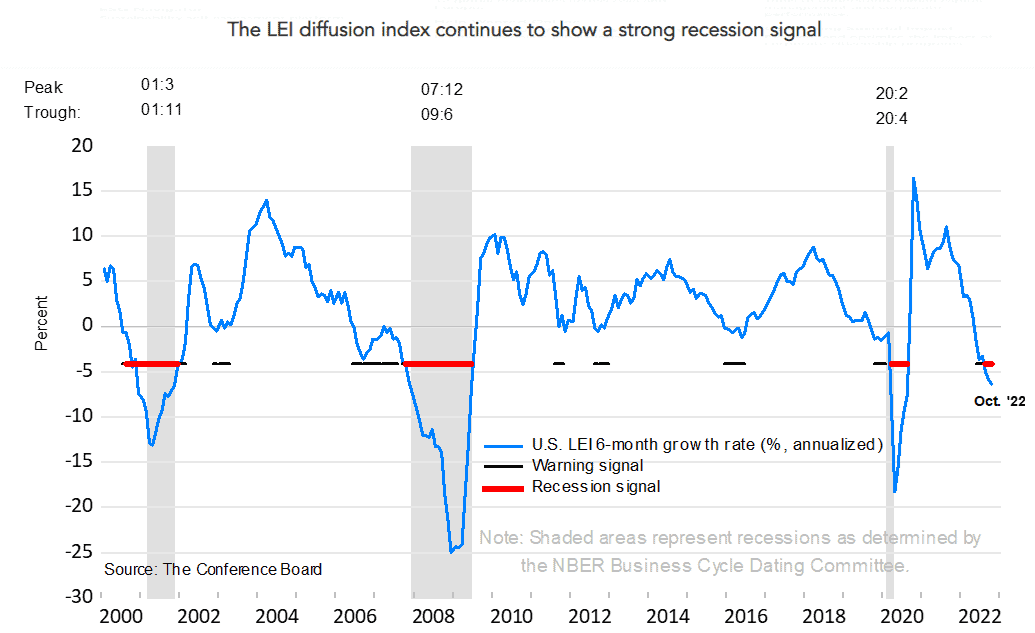
In their November report out last week, they stated…
‘The Leading Economic Index fell for an eighth consecutive month, suggesting the economy is possibly in a recession.’
So, they are suggesting the US is already in a recession.
Another very accurate forecaster of recessions is the yield curve. In the rare situation where the long-term bond yield (say 10 year) earns less than the shorter-term (say 6-month) the yield curve is inverted. Since 1955 there has been only one time where the yield curve inverted without there being a recession.
Today, the yield curve is the most inverted it has been since August’81.

Being so inverted suggests that bond investors are convinced the Fed will continue to raise rates to fight inflation. The Fed will likely need to raise rates at least another 100-bps to the 5%-5.25% range.
Stay tuned!

Special Offers
| Service | Regular Price | Special Price | Saving | Subscribe |
|---|---|---|---|---|
| Trend Letter | $599.95 | $349.95 | $250 | Trend Letter $349.95 |
| Technical Trader | $649.95 | $349.95 | $300 | Trend Technical Trader $349.95 |
| Trend Disruptors | $599.95 | $349.95 | $250 | Trend Disruptors $349.95 |
| Better Deals | ||||
| Trend Letter + Technical Trader | $1,249.90 | $549.95 | $699.95 | Trend Letter & Technical Trader $549.95 |
| Trend Letter + Trend Disruptors | $1,199.90 | $549.95 | $649.95 | Trend Letter & Trend Disruptors $549.95 |
| Technical Trader + Trend Disruptors | $1,249.90 | $549.95 | $699.95 | Technical Trader & Trend Disruptors $549.95 |
| Best Deal | ||||
| Trend Suite: Trend Letter + Technical Trader + Trend Disruptors | $1,849.85 | $649.95 | $1,199.90 | Trend Suite: TL + TTT + TD $649.95 |


