Market Notes – March 1/23
Market Overview – March 1/23
US stocks finished mostly lower Wednesday to start March as key manufacturing data offered mixed results and two Federal Reserve officials suggested a more aggressive rate-hiking campaign in the coming months. The S&P 500 declined by 0.5%, while the Dow Jones Industrial Average was flat. Contracts on the technology-heavy Nasdaq Composite fell by 0.6%.
S&P 500:
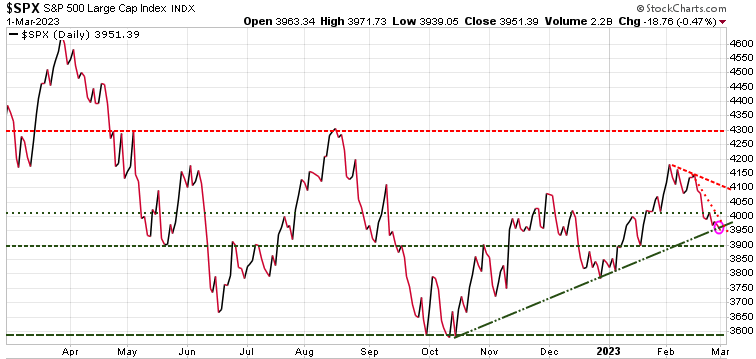
The S&P 500 continues to struggle. After a decade of ‘Don’t Fight the Fed’, investors fought the Fed, not believing they would continue to raise rates to fight inflation. Since the start of February, things have changed. Last week the S&P 500 had its worst week since December on hotter than projected inflation.
As inflation data remains ‘too high’, the markets seem to now believe that the Fed will indeed keep rates ‘higher for longer.’ The S&P 500 is now testing the uptrend line (green diagonal line) from since October. Next key support is 3900. Note that a number of technical indicators are suggesting the S&P 500 is close to being oversold, so a rally should be in the cards soon.
Gold:
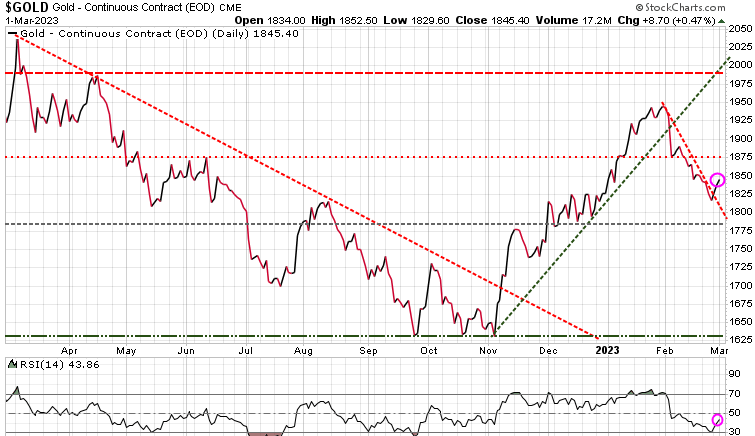
Four weeks ago, we warned that after a great run since November, gold was technically overbought. Since that call, gold twice tested near-term support at 1875, but that support level failed to hold after the 2nd test. Strength of the $US has been the main headwind for gold.
In last week’s issue of the Trend Letter we noted that gold was ‘getting over sold in the short-term, so we could see a rally here.’ Watch for 1875 as the next resistance level.
Bond Yields:
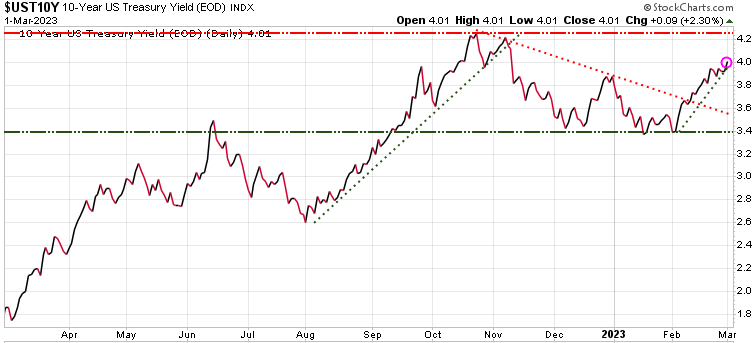
Today, the equity markets had to deal with a 10-year yield that again breached 4%. The stock market does not like to see rising yields.
Gasoline:
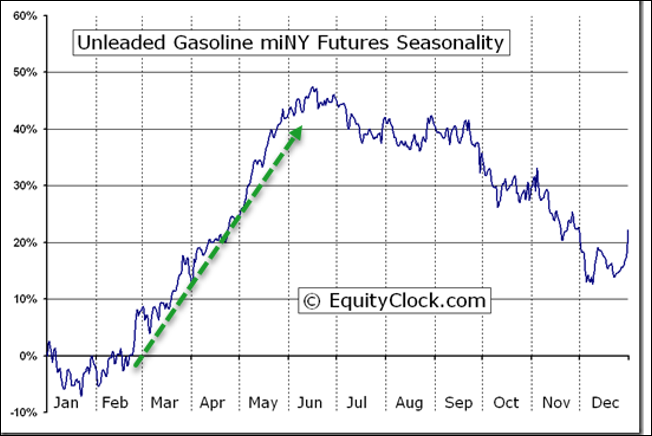
Based on seasonality, gasoline typically has a strong run from late February till June. We recently sent Trend Letter subscribers a way to play that potential upside move.
Natural Gas:
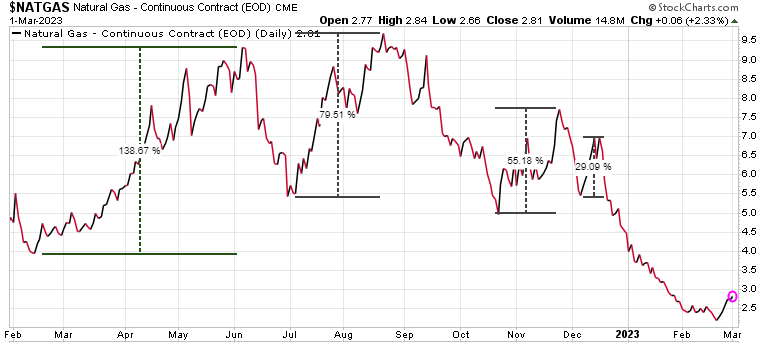
Natural gas has been hammered since its high back in August. It is heavily dependent on weather and typically it is very volatile, but that volatility works both ways and can produce some excellent short-term gains. As we can see on the chart, recent gains of 30%, 55%, 80% and 138% were all achieved within just the last year.
We recently sent subscribers two plays on natural gas, one each for Canadian and US subscribers.
Stay tuned!
