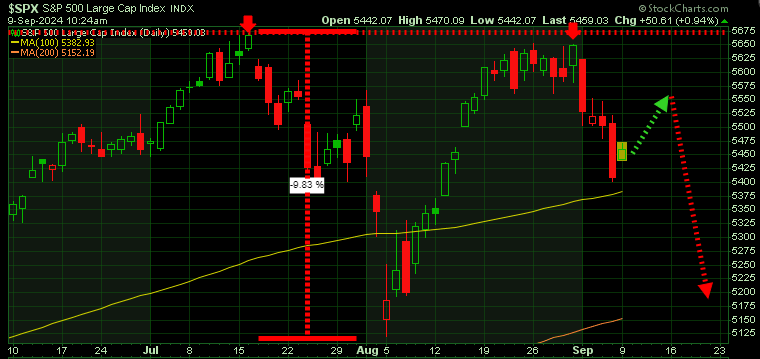
Chart Alert: Double Top Resistance Signals Potential for Sharp Decline
This is an important chart!

The S&P chart reveals two critical outside reversal weeks down from the 5,700 level—the first ending July 19th and the second just last week, on September 6th. These consecutive reversals in such a short time frame have created a powerful double top resistance.
After the July 19th reversal, we saw a retracement rally to 5,630 before plunging 500 points (~10%) to 5,100 over the next three weeks. We want to caution investors that a similar pattern is very much in play now. Following last week’s reversal, there’s potential for a bounce to around 5,550, but don’t be surprised if that rally falters.
If we reach that 5,500 level, be prepared with your hedging strategies, as the S&P could easily test its 200-day moving average near 5,150. Head on a swivel!
Stay tuned!
