Week ending November 1, 2024: Key Market Highlights
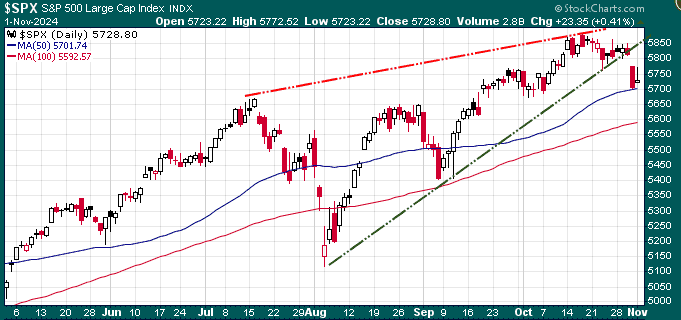
The S&P 500 drop: Key points on the chart are the breaking of the ‘rising wedge’ pattern (red & green dashed lines), and the testing of the 50-DMA (blue line). The 100-DMA (red wavy line) at 5592 would be the next key technical support level.
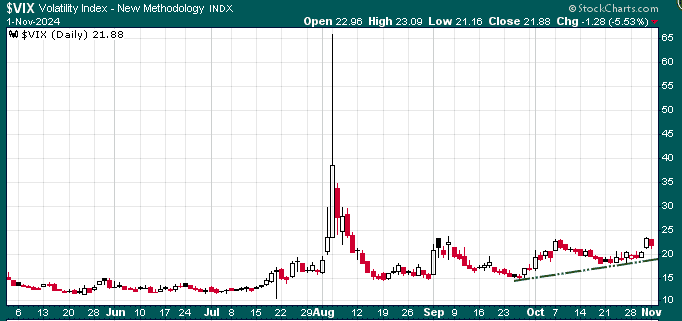
Volatility Risk: The past 12 months have delivered some of the strongest risk-adjusted returns in market history. However, volatility is now on the rise, driven by the increasing likelihood of a fiercely contested presidential election. In today’s polarized political landscape, this is far from a remote possibility.
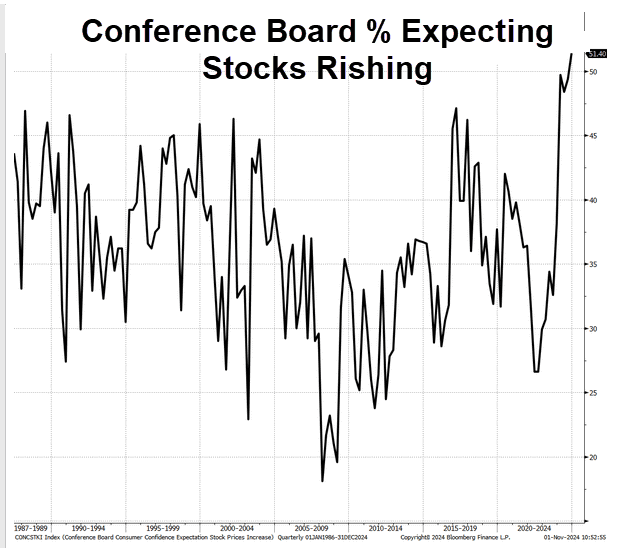
Investor optimism hits record high: The Conference Board surveys respondents on whether they believe stocks will rise or fall, and the current bullish sentiment has reached its highest level since the survey’s inception in 1986. What could go wrong?
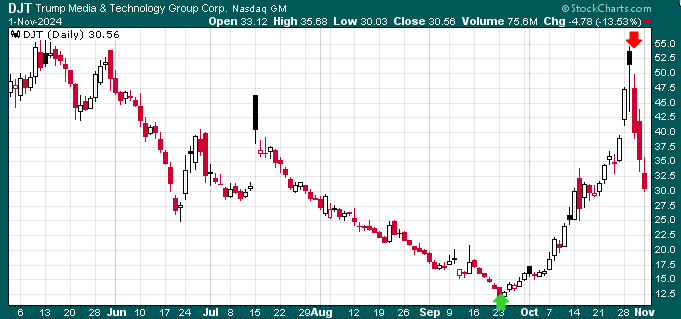
Market insights: The biggest relief about the US election may simply be that it will eventually conclude. Yet, the process could stretch for weeks, with disputes over vote counts and tactics adding to potential chaos. While we don’t anticipate a lasting impact on the market, the uncertainty is likely to drive short-term volatility and speculative losses. The best ‘election trade’ might be patience: staying focused on long-term fundamentals rather than getting swept up in the noise. In time, the distraction will fade, and attention will shift back to what truly matters.
Special Offer Extended: Due to popular demand, we’ve extended our offer to upgrade to a full Trend Letter subscription! Get 33% off now through this weekend—offer ends Sunday, November 3/24 at midnight. What are you waiting for?!
