Market on Edge: Is Nvidia Signaling a Bigger Pullback Ahead?

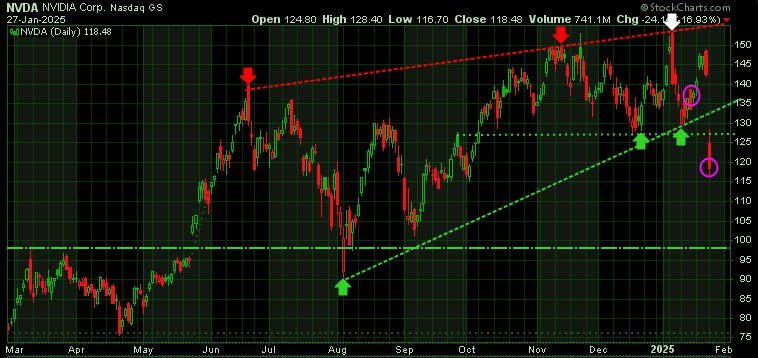
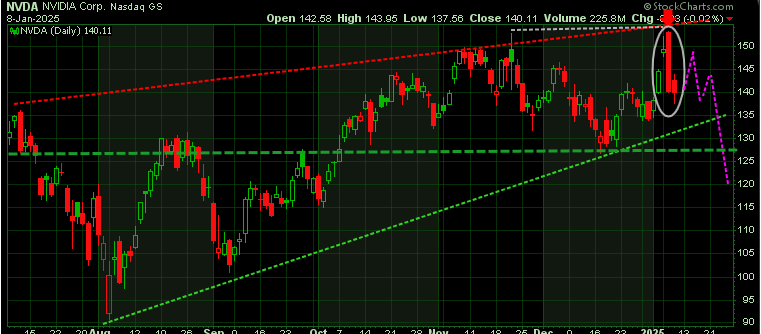
Let’s start with the hottest stock in the hottest sector of the market. Nvidia just unveiled its new compact AI superchip, the GB10, and its stock soared to a record high of $153.13 at yesterday’s open. It’s a textbook example of a meteoric rise.

But it turns out it was the classic rally on the hype of a new product. The stock quickly reversed, dropping $13.12 from peak to trough. It created an ‘outside reversal’ (circled), where the stock opened higher than previous day day, but closed much lower at $140.14 – a very bearish signal. We need to watch this carefully!

That move is very bearish and was the biggest single day pullback in NVIDIA’s history. We need to see if this is the start of a telling correction in the stock market rock star which has led the big 2024 rally.

What we are watching is to see if NIVDA breaks down below that lower rung (green diagonal line) of its wedge pattern. If it does, then we could see NIVIDA have a significant correction (purple dotted line).

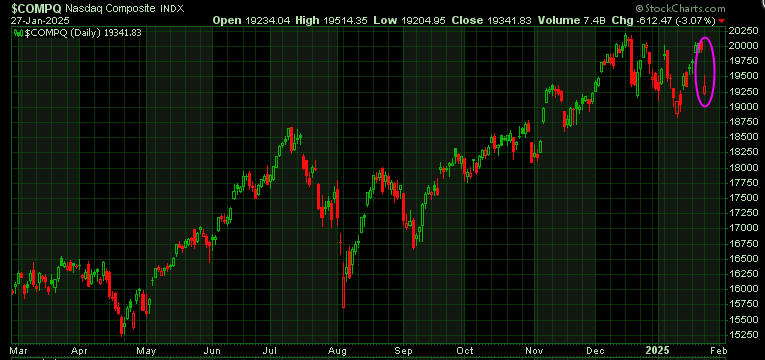
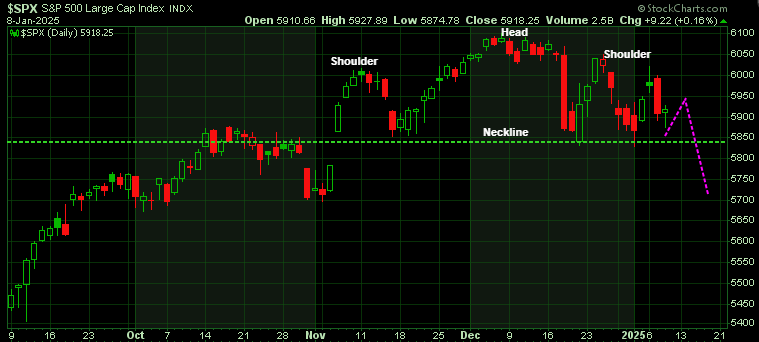
Secondly, we want to revisit the Head & Shoulders pattern we highlighted on January 2nd.

Back then, we noted that if the right shoulder of the S&P 500 breaks below the neckline (green dotted line), it could signal a significant correction in the markets.

This remains a key level to watch. A breakdown below the neckline (potential move highlighted by purple dotted lines)  would confirm the pattern and could set the stage for a broader market pullback. Keep an eye on this critical support level!

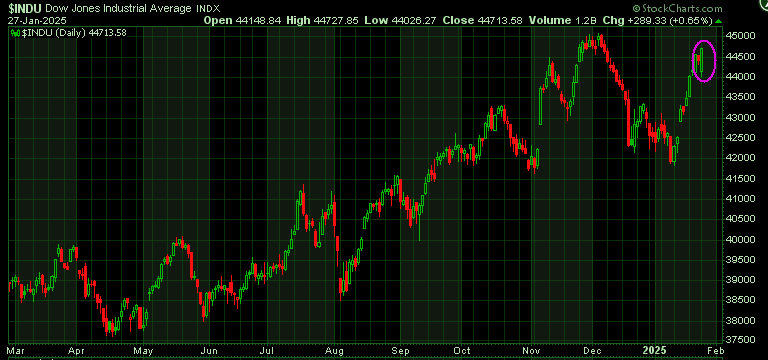
While there’s no guarantee either scenario will play out, if NVIDIA breaks down, it could drag the rest of the market down with it.

Stay tuned!

Protect, Empower & Grow Your Wealth

Trend Letter

Since its inception, Trend Letter has consistently provided investors with actionable insights and a proven track record of accuracy.

  • Weekly publication every Sunday evening.
  • Comprehensive 50–60-page analysis.
  • Concise content with key bullet points and easy-to-read charts.
  • Recognized by Timer Digest for top performance in Bonds, Gold, and Stocks.

 Subscribe Now


Trend Technical Trader (TTT)

Protect and grow your wealth with advanced market timing strategies.

  • Premier hedging service for rising and falling markets.
  • Exceptional returns on both short and long positions.
  • Access to our proprietary Gold Technical Indicator (GTI).

 Subscribe Now


Trend Disruptors

Stay ahead with insights on disruptive technologies reshaping industries.

  • Focus on AI, VR, AR, 5G, Quantum Computing, and more.
  • Identify high-potential stocks early.
  • Capitalize on cutting-edge opportunities.

 Subscribe Now

“Head & Shoulders Pattern Forms – Key Market Moves Ahead This Friday”

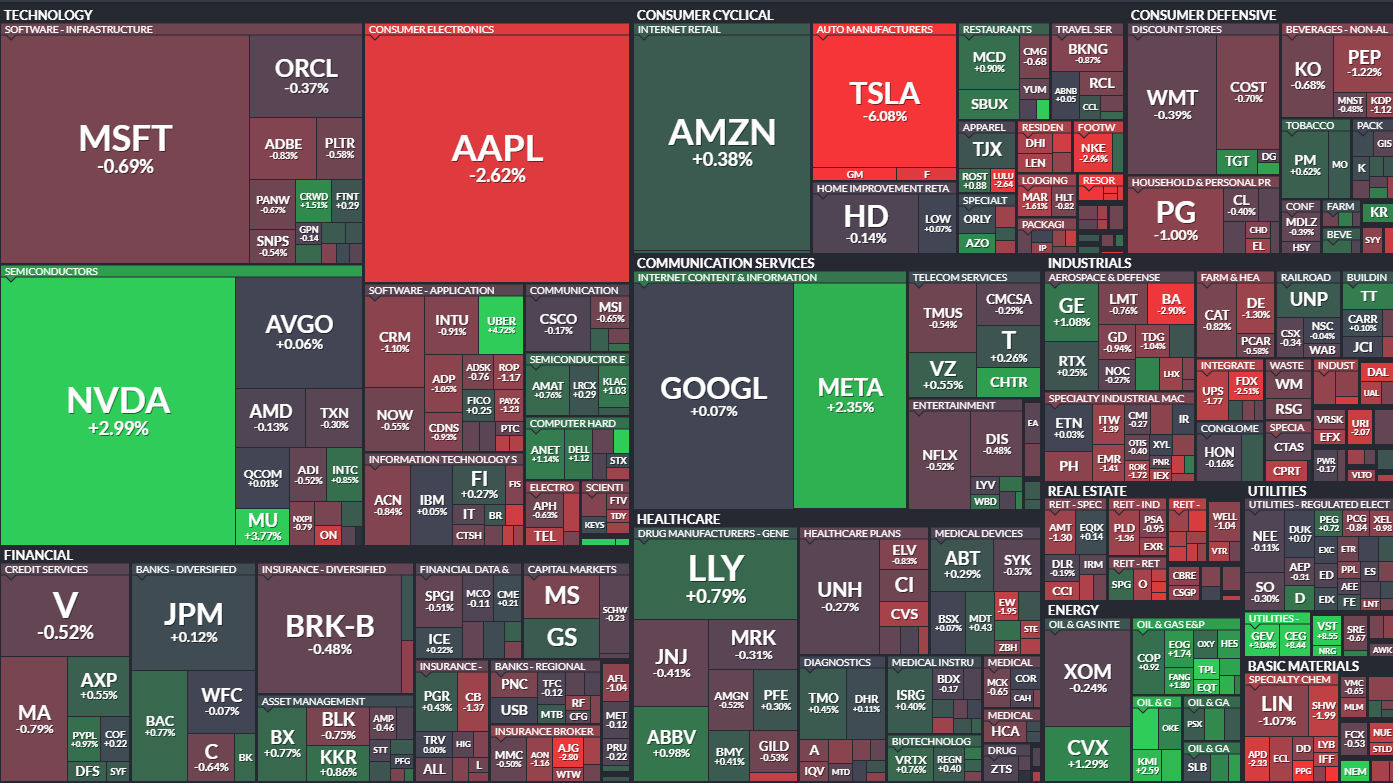
As of January 2, 2025, the much anticipated Santa Claus rally is failing to materialize. The S&P 500 heat map painted another grim picture, with most sectors in the red. However, Nvidia and Meta managed to post solid gains today, while the oil sector continued to show some resilience. Outside of those and a few other bright spots, the broader market remained under pressure.

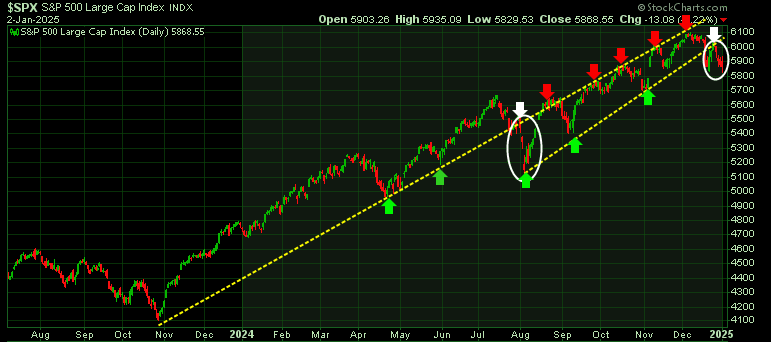
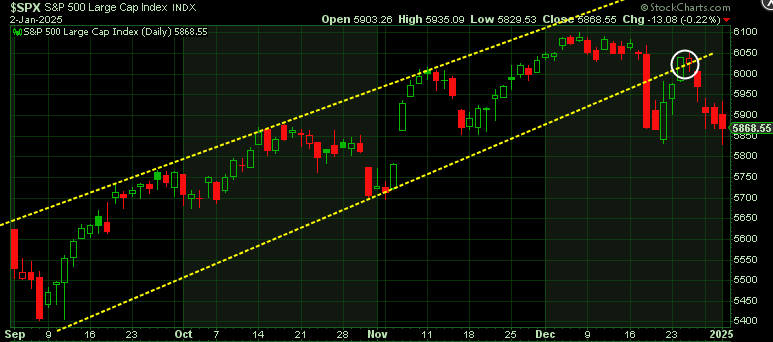
Over the past few weeks, we’ve highlighted a critical technical trend we’ve been closely monitoring. On the chart below, we’ve drawn a trend line (upper yellow diagonal line) connecting the November low to the present. From November to August of this year, this trend line served as support, but in August, it failed to hold (first white arrow and circle). Since then, it has acted as a resistance level (red arrows).

Following the breakdown in August, we established a second, lower trend line by connecting the subsequent lows. This lower line has provided key support for the S&P 500 up to December 18th. However, since then, the index has struggled to re-enter the channel between these two trend lines.

Zooming into a shorter timeframe, we can clearly see the S&P 500 rallied to test the lower boundary of the uptrend channel but failed to break through (white circle). Since then, it has turned lower.

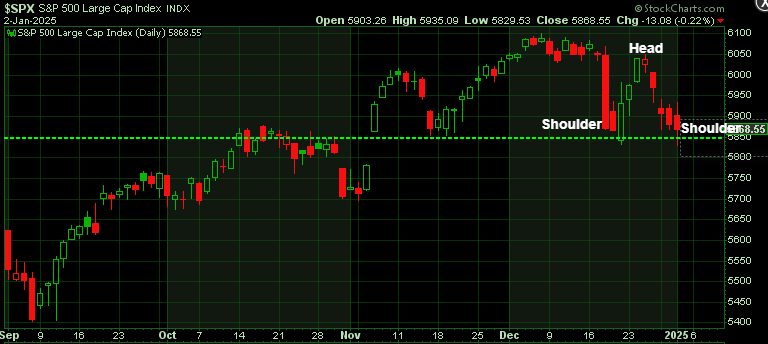
A Head & Shoulders pattern is now forming, signaling a potential bearish scenario. If the right shoulder breaks below the neckline (green horizontal line), it could trigger a more substantial decline.

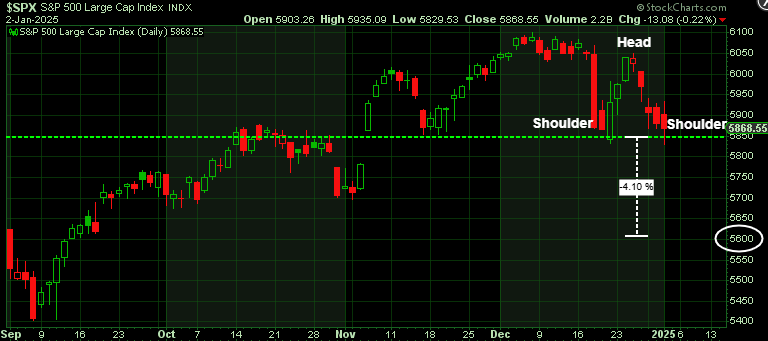
To estimate the potential downside, we measure the distance from the head to the neckline and project that downward. This suggests a support target around the 5600 level.

As of today, the neckline remains intact, so there’s no confirmation of an imminent decline. Friday’s market action will be crucial—either the neckline holds, prompting a rebound, or it breaks, paving the way for lower lows with an initial target near 5600.

Stay tuned !