“Head & Shoulders Pattern Forms – Key Market Moves Ahead This Friday”
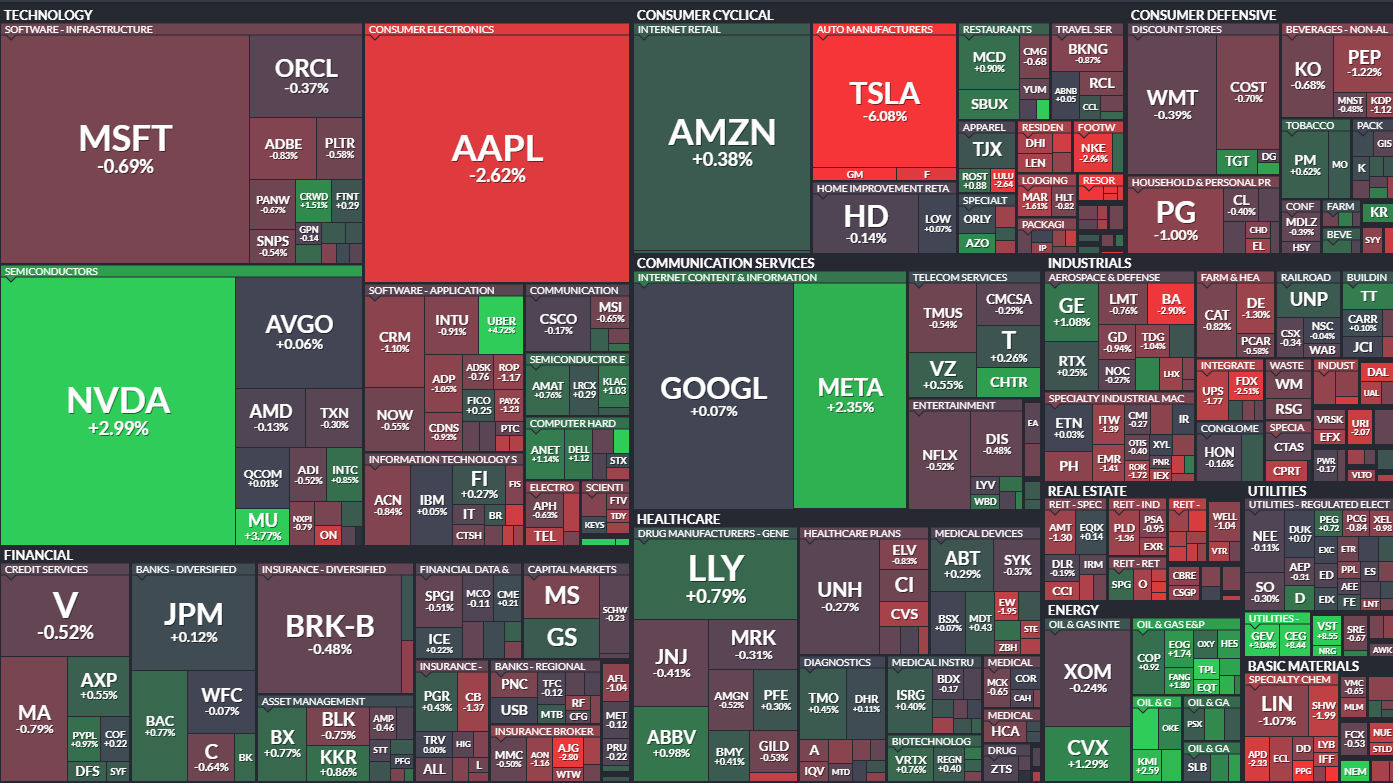
As of January 2, 2025, the much anticipated Santa Claus rally is failing to materialize. The S&P 500 heat map painted another grim picture, with most sectors in the red. However, Nvidia and Meta managed to post solid gains today, while the oil sector continued to show some resilience. Outside of those and a few other bright spots, the broader market remained under pressure.
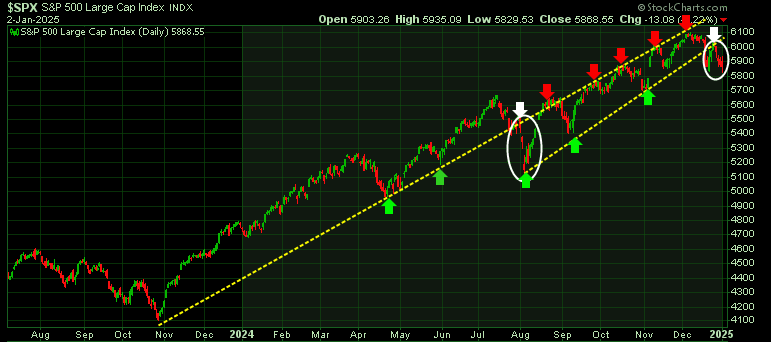
Over the past few weeks, we’ve highlighted a critical technical trend we’ve been closely monitoring. On the chart below, we’ve drawn a trend line (upper yellow diagonal line) connecting the November low to the present. From November to August of this year, this trend line served as support, but in August, it failed to hold (first white arrow and circle). Since then, it has acted as a resistance level (red arrows).
Following the breakdown in August, we established a second, lower trend line by connecting the subsequent lows. This lower line has provided key support for the S&P 500 up to December 18th. However, since then, the index has struggled to re-enter the channel between these two trend lines.
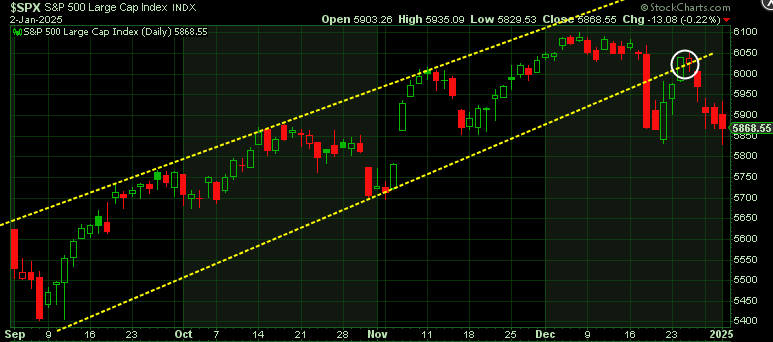
Zooming into a shorter timeframe, we can clearly see the S&P 500 rallied to test the lower boundary of the uptrend channel but failed to break through (white circle). Since then, it has turned lower.
A Head & Shoulders pattern is now forming, signaling a potential bearish scenario. If the right shoulder breaks below the neckline (green horizontal line), it could trigger a more substantial decline.
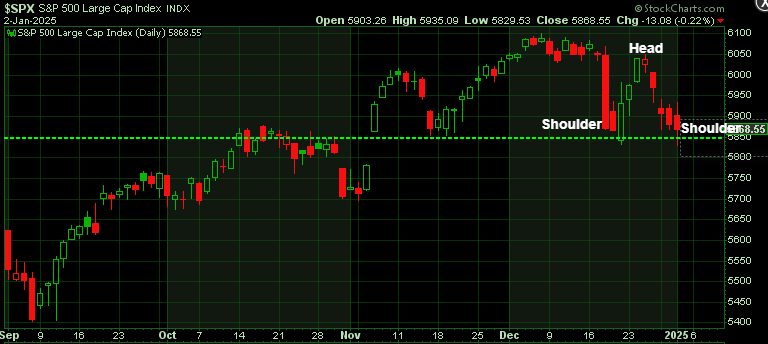
To estimate the potential downside, we measure the distance from the head to the neckline and project that downward. This suggests a support target around the 5600 level.
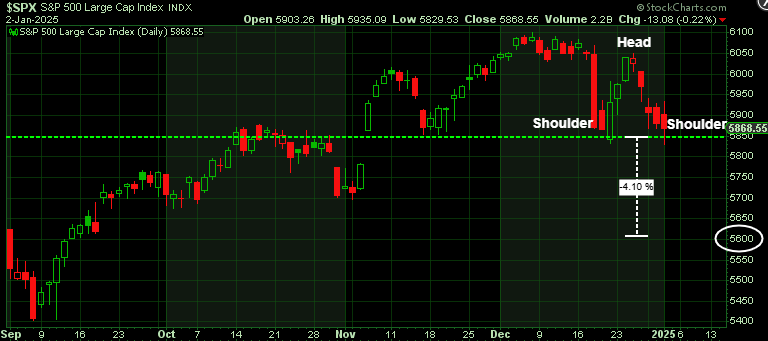
As of today, the neckline remains intact, so there’s no confirmation of an imminent decline. Friday’s market action will be crucial—either the neckline holds, prompting a rebound, or it breaks, paving the way for lower lows with an initial target near 5600.
Stay tuned !
