Market Recovery or Temporary Relief? Key Insights on S&P 500 & Gold
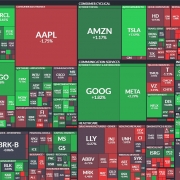
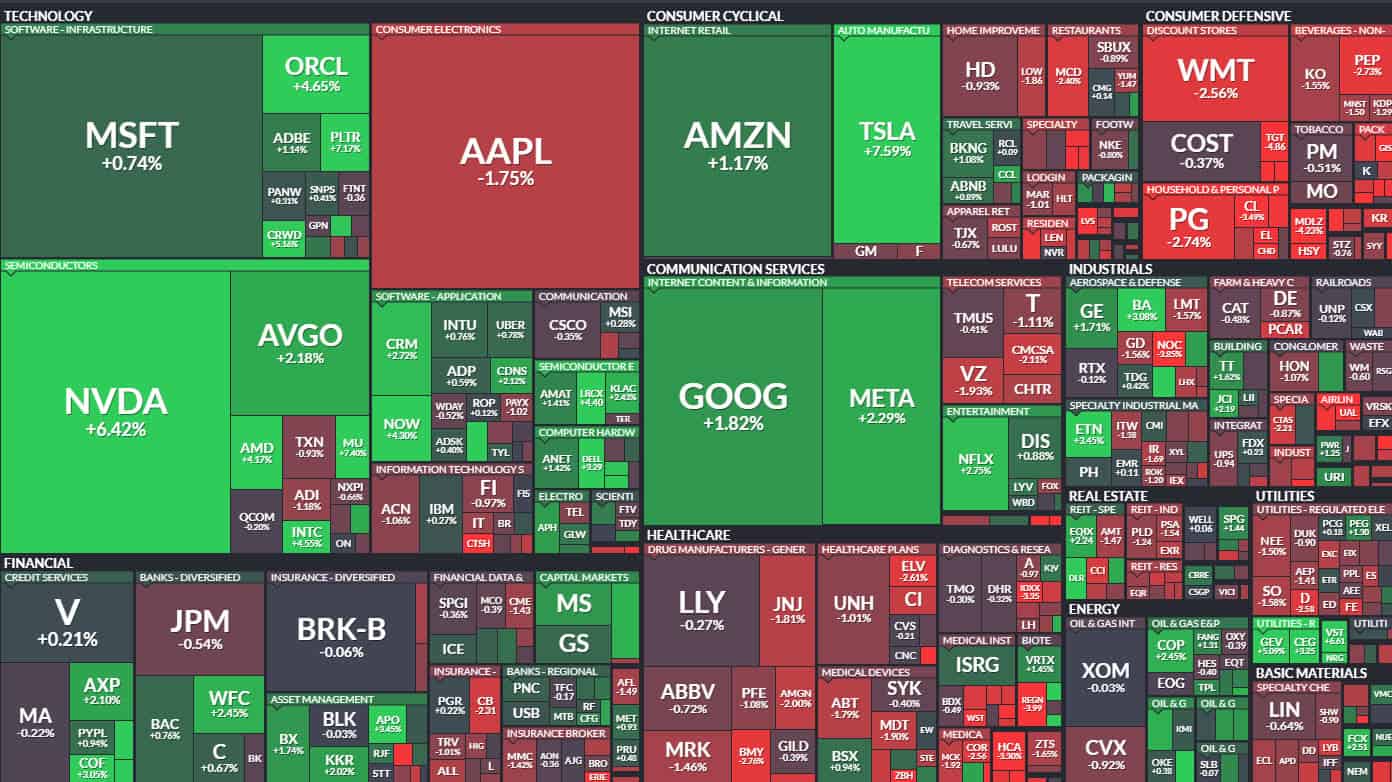
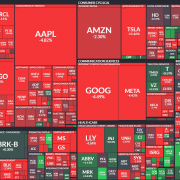
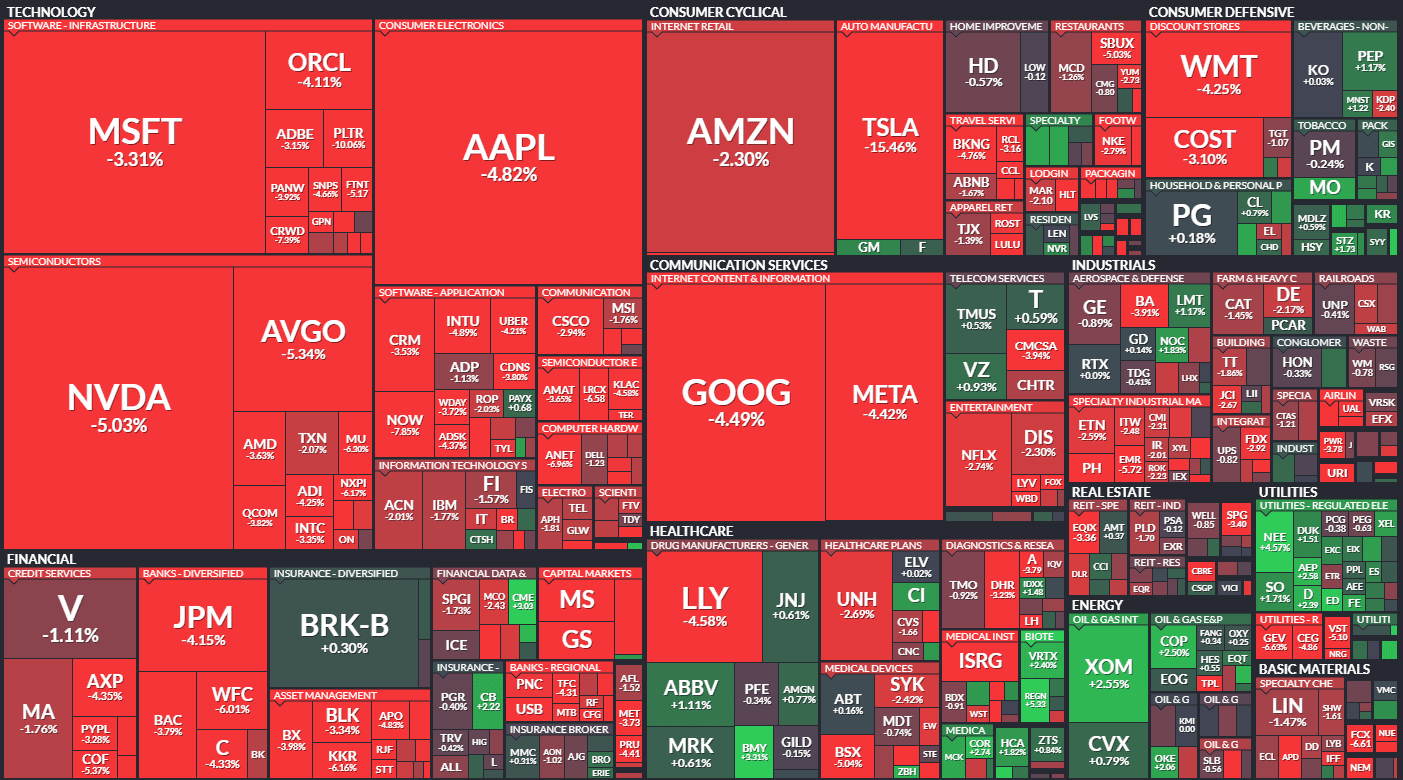
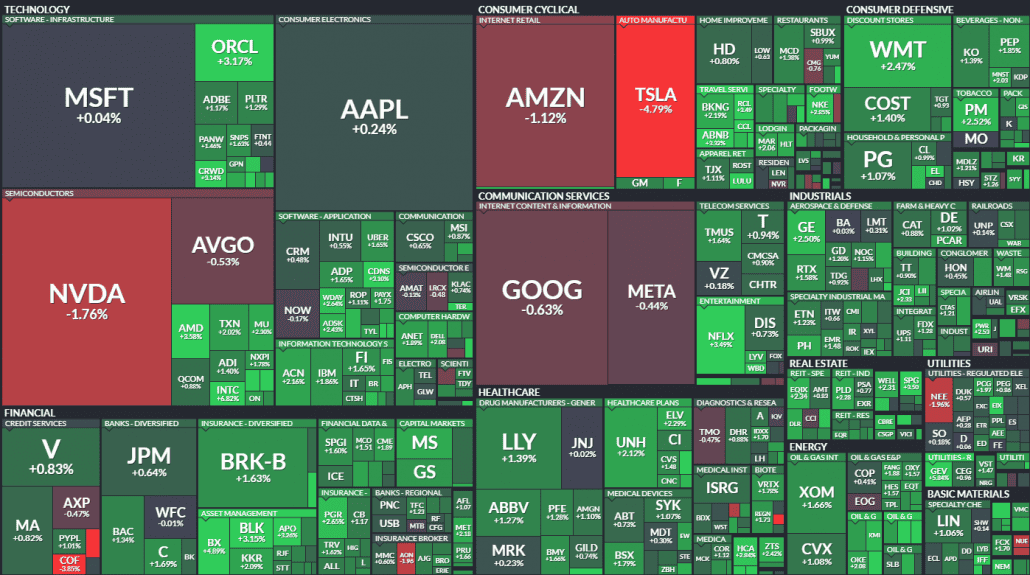
The S&P 500 closed higher for the second consecutive day, marking a positive turn after four weeks of negative results. The index rose 0.6% to 5,675.12, showing signs of recovery after entering correction territory last week. However, Tesla and Nvidia bucked the trend, with Tesla down 5.36% to $236.55 and Nvidia down 1.98% to $119.27.
Key drivers included weaker-than-expected retail sales data, which raised expectations for potential Federal Reserve rate cuts later this year. Investors are also closely watching the Fed’s two-day meeting starting Tuesday, where rates are expected to remain unchanged.
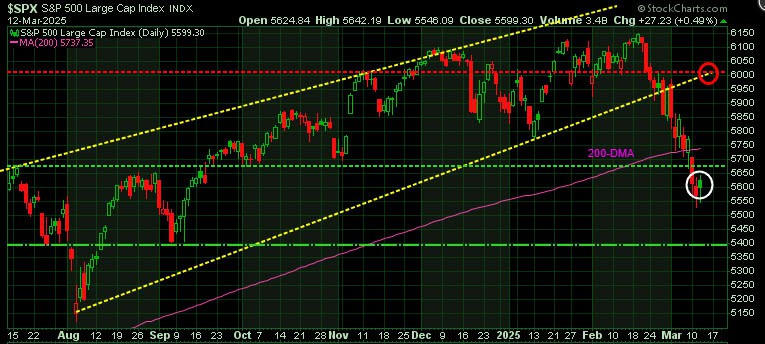
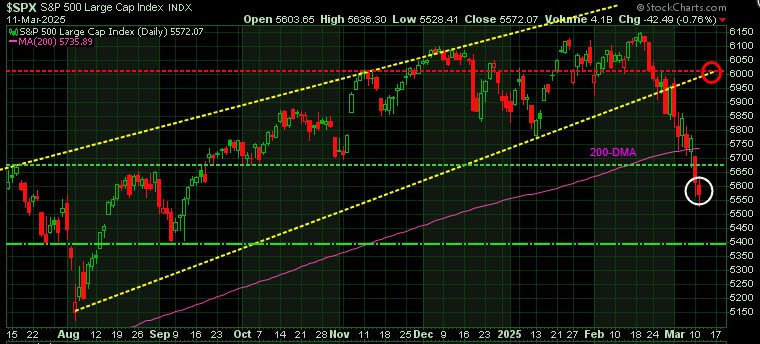
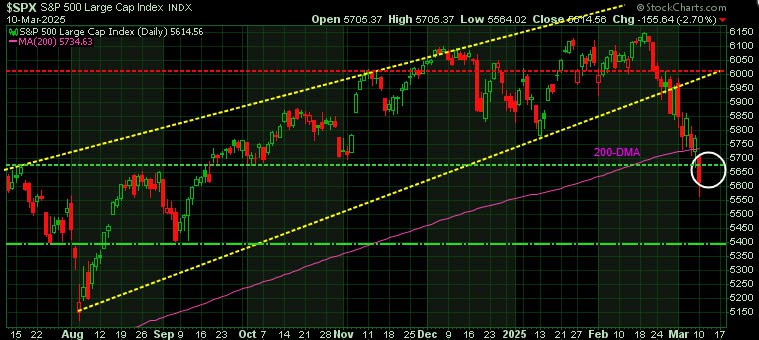
Technical Analysis of the S&P 500:
The S&P 500 successfully pushed through and closed above its previous support level at 5670. This marks the first test of the current rally. The next challenge will be to surpass the early January low at 5775 (red horizontal line), which is expected to present stronger resistance.
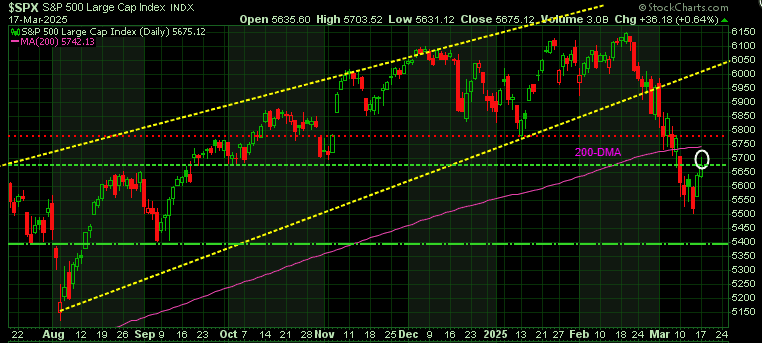
These tests are crucial in determining whether this rally represents a ‘buy the dip’ recovery or a ‘sell the rip’ dead cat bounce. Previously, when the S&P 500 was trending within its upward channel, declines within the channel offered ‘buy the dip’ opportunities. However, with the index now below that channel, any bounce must demonstrate strength by breaking through key resistance levels to avoid the risk of further downside.
It’s important to note that losing support at 5,670 has left the S&P 500 vulnerable to potentially testing its next key support level just under 5,400.
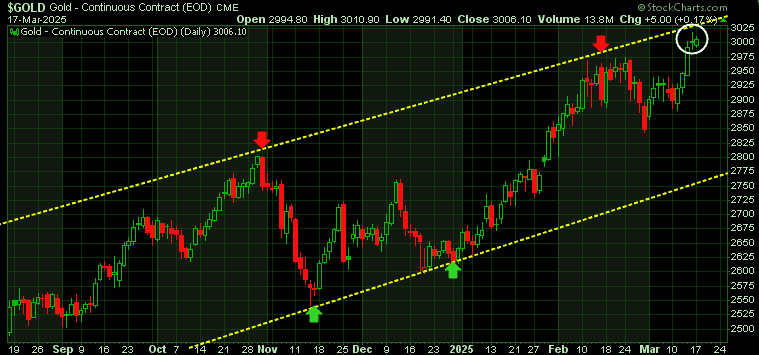
Gold Update:
Gold has experienced an impressive surge over the past two and a half years, climbing 85% since November 2022. Currently, it is testing the upper boundary of its uptrend channel (white circle), which suggests that this resistance level is likely to hold. As a result, a pullback or consolidation appears probable. Such a correction would be a healthy development for gold, allowing it to build momentum and gather strength for its next potential move higher.
Navigate Market Volatility with Confidence
The current market environment presents both challenges and opportunities for investors. As we navigate through this period of uncertainty, it’s crucial to stay informed and make strategic decisions.
Now is the perfect time to subscribe and gain trusted guidance in these uncertain markets. Our mission is to help investors make well-informed decisions when it matters most.
To support you, we’re reopening our Special Offers from the WOFC 2025 Conference—giving you 33%–57% off regular subscription rates. Claim your exclusive discount today!
Stay ahead of the curve—seizing market opportunities starts here!
Martin