Markets Slide as Political Turmoil Erodes Confidence

Global equities tumbled Monday, driven by political instability, policy uncertainty, and rising trade tensions. Trump’s threat to fire Fed Chair Jerome Powell further undermined confidence in the Fed’s independence and the broader US financial system.

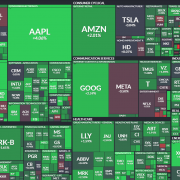
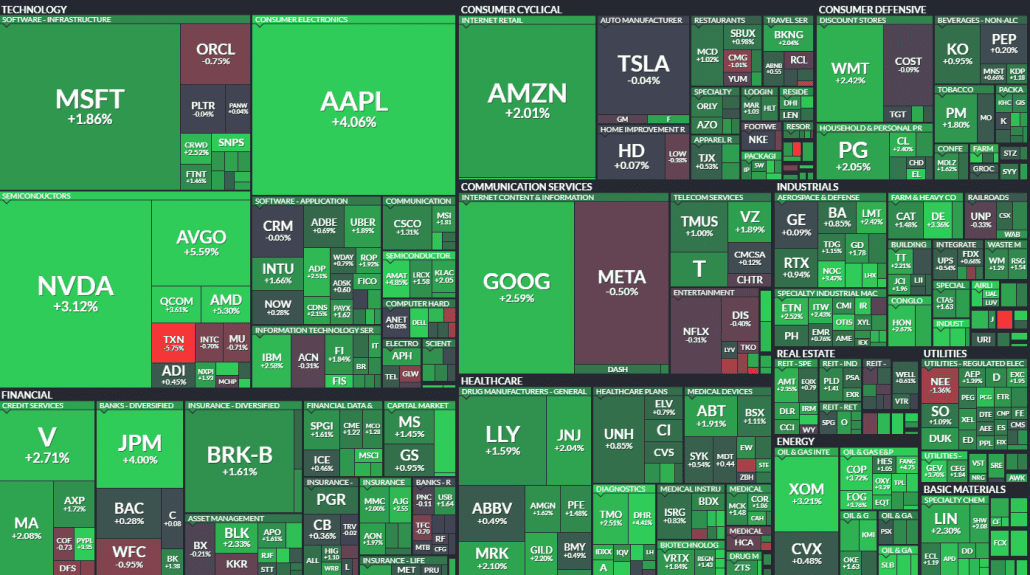
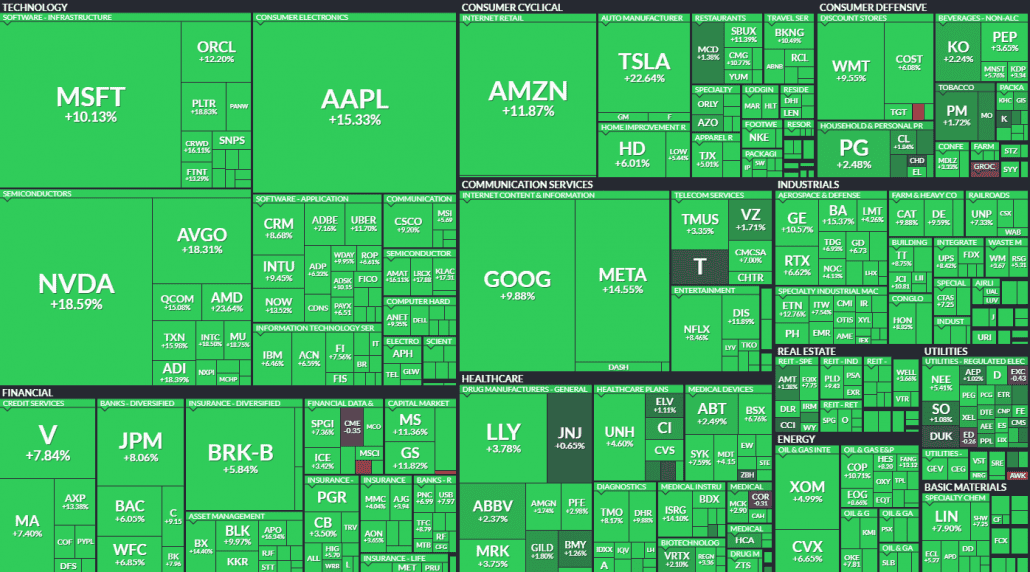
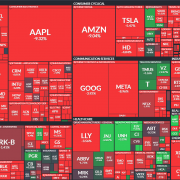
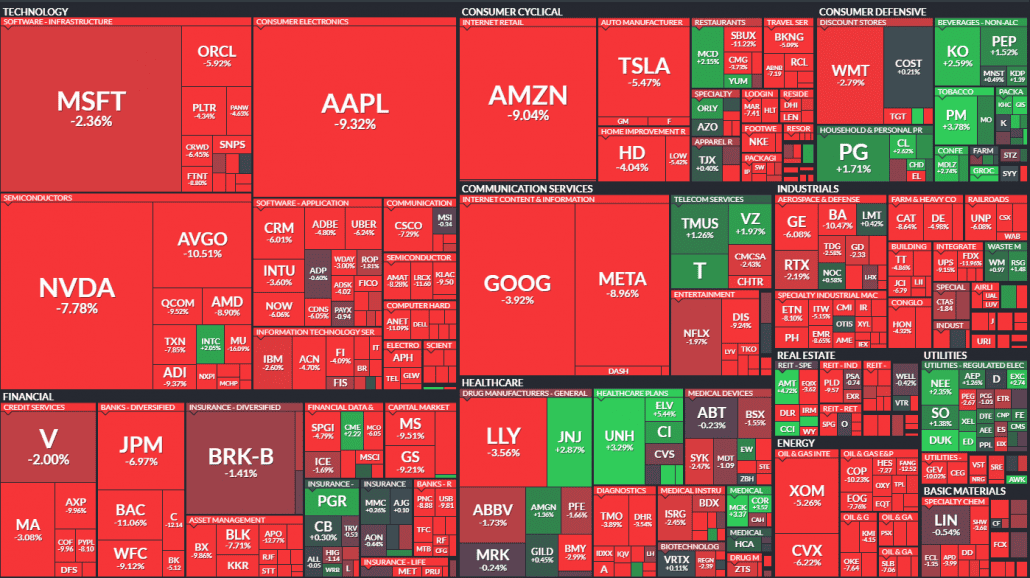
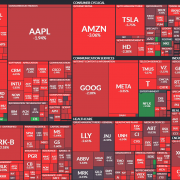
The S&P 500 heatmap was a sea of red, with Netflix a rare bright spot. Major tech names led the decline: Tesla (-5.75%), Nvidia (-4.51%), Salesforce (-4.45%), and Meta (-3.51%).

S&P 500 Technical Analysis

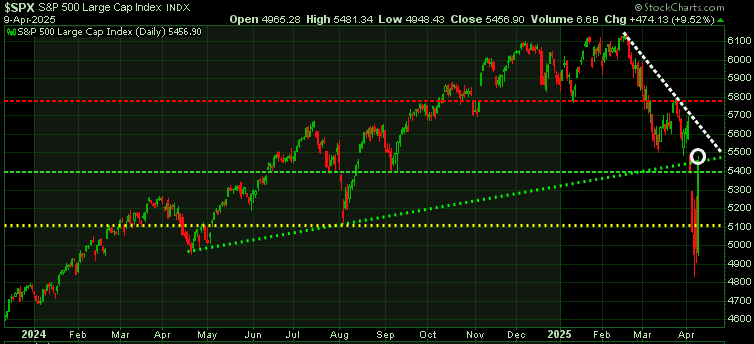
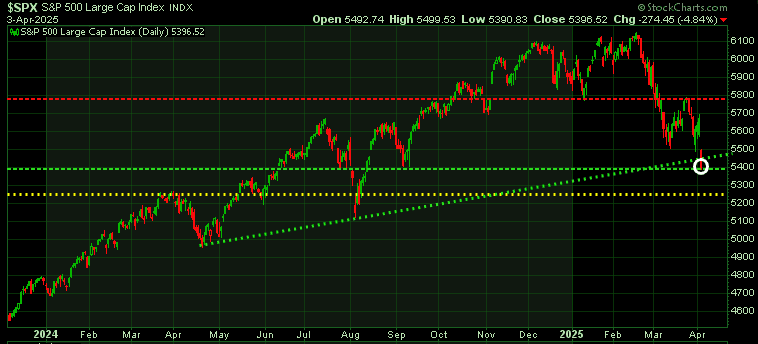
For the S&P 500, initial resistance is at 5,500 (lower red horizontal line); a break above that opens the door to 5,700 (upper red horizontal line). Support sits just under 5,000 (upper green horizontal line), with 4,800 (lower green horizontal line) as a key weekly level to watch.

Any positive trade deal headlines could spark a bounce this week, but further US–China escalation would cap upside potential. The longer uncertainty lingers, the greater the damage to the global economy, and declining business and consumer confidence is a long-term drag on equities.

For short-term traders, a dip to  5000 could trigger a bounce, but any rebound is likely capped at 5400.
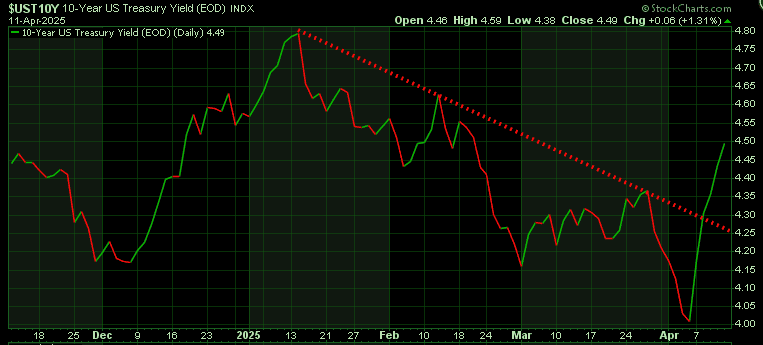
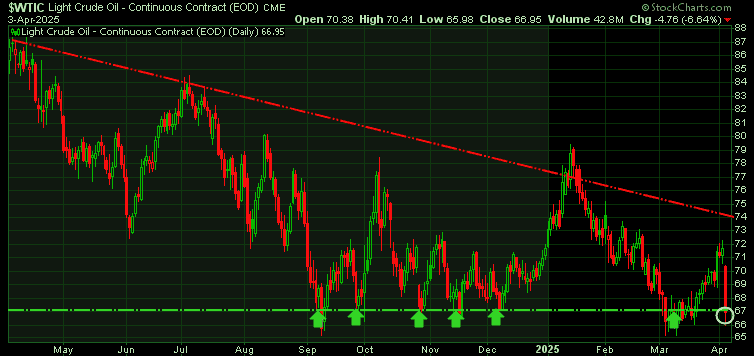
Bond Yields Rising

Yields jumped on inflation fears, declining foreign demand, and policy chaos:

  • Tariff Shock: Trump’s April 2 tariffs first triggered recession fears, then inflation worries—pushing yields higher.
  • Foreign Selling: China and Japan cut Treasury purchases, while weak auctions and hedge fund deleveraging sent the 10-year yield to 4.5% intraday (April 8). Many allies, frustrated with Trump, see little reason to back U.S. debt.
  • Economic Risk: Higher yields threaten U.S. debt servicing ($37T) and consumer borrowing, deepening financial stress.

Flight to Safety

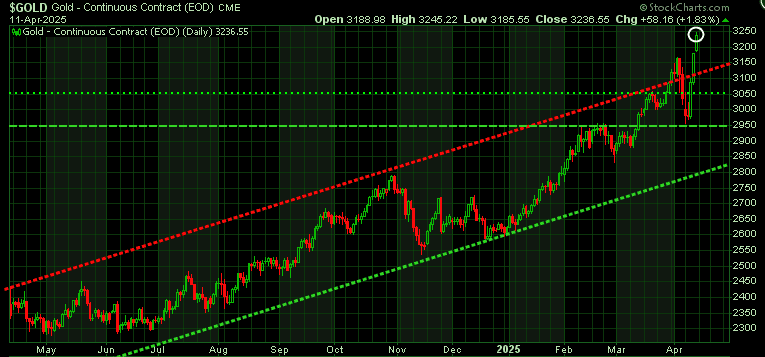
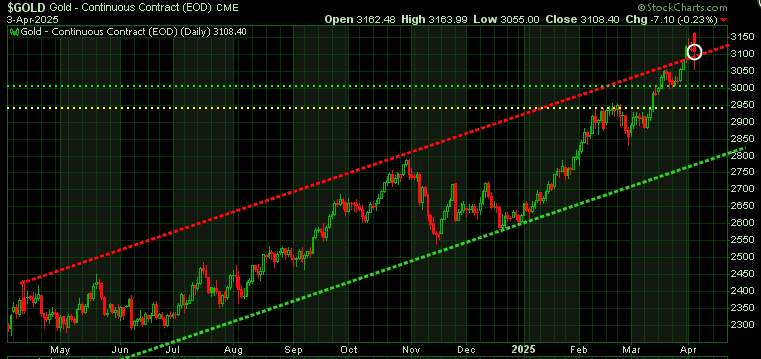
Gold hit a fresh all-time high at $3,422, now up 31% year-to-date, on pace for its best annual gain since 1979. Though technically overbought, it remains the go-to safe-haven. Trade war fears are driving investors, hedge funds, and central banks to unload US assets and pile into gold.

The primary retail buyers are in Asia.

Looking back to gold’s 2011 high, we see it trading within two parallel channels. The last time we saw intersecting channel, it marked a major low in late 2022 (lower white circle).

With the lines crossing again near current levels (upper white circle), this could signal a potential short-term top. A meaningful pullback from here could present a solid buying opportunity.

Bitcoin Rallies as Dollar Slides

Bitcoin posted its strongest day in weeks, fueled by a combination of macro pressures and renewed institutional interest. Confidence in traditional assets took a hit as Trump’s attacks on the Federal Reserve and its leadership weakened the US dollar, driving investors toward Bitcoin as a hedge. Meanwhile, institutional demand picked up, highlighted by Japan’s Metaplanet buying 330 additional BTC and strong inflows into US Bitcoin ETFs.

Bitcoin is now testing initial resistance at $88.3K, with major resistance at $92.5K – the same level that served as strong support from November through December.

Keep your head on a swivel  – this is far from over!

Stay tuned!

Martin

Markets Rally, Bonds Break, Gold Soars—What You Need to Know

Markets End Volatile Week with a Strong Rebound – April 11, 2025

Markets capped a wild week with a strong finish, shrugging off trade war shocks and riding a wave of optimism:

  • Stocks Bounce Back: After days of volatility, the Dow surged 600 points (+1.6%), the S&P 500 climbed 1.8%—its best week since October 2023—and the Nasdaq jumped 2.1%, led by a tech resurgence.
  • Trade War Tensions: Markets were rattled by China’s retaliatory tariffs of up to 125% and President Trump’s aggressive 145% hikes on Chinese imports. Yet, solid bank earnings and cooling inflation helped restore investor confidence.
  • Flight to Safety: Gold soared to a record high as a safe-haven play, while 10-year Treasury yields surged to 4.53%, approaching multi-decade highs.
  • Tech Leads Recovery: Mega-cap tech stocks including Nvidia, Microsoft, and Tesla staged a strong rebound after Thursday’s sharp selloff.

Despite intense geopolitical and market pressure, Wall Street closed the week with notable strength, showing surprising resilience.  ​The  S&P 500’s performance for the week ending, was its strongest since November 2023. Here is today’s heat map:

How 145% Tariffs on Chinese Imports Could Shock U.S. Consumers

With over 70% of key consumer goods like smartphones, furniture, and video games sourced from China, tariffs could trigger sharp price hikes across everyday essentials.

Bond Market Flashing Red: Why Yields Are Surging Despite Stock Market Weakness

There’s a notable shift in Trump’s focus this term compared to his first. Back then, he constantly cited the stock market as proof of a strong economy. This time, he’s barely mentioned it.

Instead, the emphasis is on policy—tax cuts, deregulation, spending restraint—and notably, lower borrowing costs. His Treasury Secretary, Scott Bessent, a former hedge fund manager, has made it clear: the goal is to bring down the 10-year Treasury yield.

But the market isn’t cooperating.

The 10-year yield, which dipped to 3.7% on April 4, has surged to nearly 4.5%—an 80 basis point jump in just one week. That’s the opposite of what Trump and Bessent want. Rising yields suggest the bond market expects higher inflation, even as economic growth slows—a recipe for stagflation.

Stagflation puts the Fed in a tough spot. Cutting rates could fuel inflation, but rising yields make borrowing more expensive for consumers, businesses, and the government.

So why are bonds selling off while stocks are falling? Isn’t the bond market supposed to be a safe haven?

The first part of the answer  answer lies in the scale of US borrowing. The government needs to issue $7–8 trillion in new debt this year to fund ongoing deficits and refinance maturing debt. With annual deficits exceeding $2 trillion and total debt above $37 trillion, supply is overwhelming demand.

Layer in the geopolitical angle: the US and China are in a full-blown trade war. China—America’s second-largest foreign bondholder—has leverage. If China were to start selling US Treasuries while the US is issuing trillions more, bond prices would plunge and yields would spike.

Plus, many US allies aren’t exactly eager to support bond auctions while facing tariffs of their own. Why help fund a government that’s targeting your economy?

If yields continue climbing toward 5% or higher, it could spell serious trouble for the US economy—and likely drag the stock market down with it.

Gold Surges to New Highs as Safe Haven Demand Soars

Gold is ripping higher—up $70 today to a fresh all-time high of $3,250.

Just last week, it dipped to $2,970 during a broad market panic that triggered liquidation across all assets—gold included. It was a classic case of the baby getting thrown out with the bathwater. But that selloff didn’t last. Investors quickly stepped back and asked: What are the real safe haven plays right now?

Treasuries? The yen? Neither offer the confidence they once did. Bitcoin has been trading more like a tech stock than a store of value. That leaves gold—and it’s showing why it still holds safe-haven status.

Notably, gold doesn’t look like a crowded trade. COT data last Friday showed net-long positions at year-over-year lows, a bullish contrarian signal.

Yes, gold is expensive relative to other assets:

  • The gold/oil ratio is at 53:1 (vs. a historical average of ~20:1).
  • The gold/silver ratio has ballooned to 103:1 (vs. a long-term norm around 50–60:1).

But these extreme ratios reflect deep global uncertainty. The West’s seizure of Russian reserves and removal from SWIFT showed that financial infrastructure can be weaponized. That sent a clear message to countries like China, Russia, and Iran: don’t trust the West—buy gold.

Add in today’s escalating trade wars and rising geopolitical risk, and it’s no surprise that central banks are aggressively adding to their gold reserves. Retail investors are following suit, looking for a hedge amid global turmoil.

Key levels to watch:

  • Resistance: $3,300
  • Initial support: $3,050
  • Major support: $2,960 (last week’s low)

For now, gold remains in a strong uptrend. It may pause or consolidate, but there’s little to support a bear case in the near term.

Stay tuned!

Markets Now Move at Trump’s Whim

Forget AI hype. Forget earnings. These days, stock prices hang on one thing: what President Trump says next. His words spark chaos, drive momentum, and overshadow everything else.

After announcing ‘reciprocal tariffs’ on April 2, markets plunged for four straight days. Then, at 1:18 PM today, he took to social media to say he’s ‘substantially lowered’ those tariffs to 10% for a 90-day negotiating window. At the same time, he doubled down on China—raising their tariff rate to 125%.

The market reaction? Instant. Explosive. Stocks ripped higher with near-record gains on a massive 30 billion shares traded. It wasn’t earnings, data, or innovation that moved the needle—it was a single post.

Key Highlights:

  • Major Index Performance:
    The Dow Jones Industrial Average surged nearly 3,000 points, or 7.87%, to close at 40,608.45—its largest percentage gain since March 2020. The S&P 500 jumped 9.52% to 5,456.90, notching its best single-day performance since 2008. The Nasdaq led the charge, skyrocketing 12.16% to finish at 17,124.97.
  • Sector Performance:
    Technology stocks fueled the rally, with Apple climbing over 15% and Nvidia surging nearly 19%. Tesla saw a sharp gain of more than 22%. Defensive sectors, including health insurance and defense, also posted solid gains following favorable policy developments.

We’ve reached the point where markets no longer move on earnings, revenue growth, or even AI hype. Now it’s all about what the President says—and the reactions are massive. One post, one offhand announcement, and stocks either soar or sink.

Today’s violent rebound, coming right after a steep selloff, draws uncomfortable parallels to past meltdowns—think the Dotcom Bust or the Financial Crisis—when similar sharp swings masked deeper instability..

Wild Ride: 533-Point Swing Sets Up Key Test

Today’s massive intraday move—from a low of 4,948 to a high of 5,481—was a jaw-dropping 533-point swing. The next key resistance? The white downtrend line, hovering around the 5,500 level.

A Trader’s Dream Day—But Caution Still Rules

Today was a gift for short-term swing and day traders. Some of the biggest rallies happen in bear markets, and this was a textbook example.

While there may be a bit more upside in the near term, uncertainty still looms large—and markets hate uncertainty. Relief rallies can be powerful, but let’s be clear: we’re still in a downtrend – at least for now.  The S&P 500 needs to push through 5500and hold above that level.

Stay tuned!

Recent Hedging Wins Speak for Themselves

Recent Hedging Wins Speak for Themselves

As market volatility continues to dominate the financial landscape, having a reliable hedging strategy is no longer optional—it’s essential. Recent market activity has once again shown the power of using targeted instruments to both protect your portfolio and capture meaningful gains.

Take a look at some of the Trend Technical Trader (TTT)’s recent results that illustrate the effectiveness of these strategies:

EWV – ProShares UltraShort MSCI Japan

Delivered a 22% gain (including dividends)

FAZ – Financial Bear 3x

Produced a 37% gain

TZA – Small-Caps 3x Bear

Locking-in a 27% return

VXX – Volatility ETF

A 15% gain following an earlier position that returned 101% last August

These results highlight how strategic hedging—through inverse ETFs, volatility trades, and sector-specific plays—can not only protect your capital but also deliver strong upside in uncertain markets.

At Trend News, our priority is to help you navigate volatility with confidence by applying tested strategies that manage risk while seeking high-potential opportunities.

Not a Subscriber Yet?

Now’s a great time to join our TTT family.

To help you get started, we’re offering 33% off our regular subscription price—a savings of $250—so you can gain access to the same proven insights and timely recommendations.

Stay tuned for our next round of picks as we continue to adapt and respond to the ever-changing market environment. Click here to view our Special Offer

Markets Tumble as Tariff Shock Sparks Global Selloff

Global stock markets suffered a steep crash today after President Donald Trump announced sweeping new tariffs, triggering one of the worst trading days in years.

Major Index Losses

  • Dow Jones Industrial Average plummeted 4%, shedding 1,680 points — its steepest single-day drop since 2020.
  • S&P 500 sank 4.8%, approaching correction territory.
  • Nasdaq Composite plunged 6%, officially entering correction territory with a 16.8% decline from its December peak.

Sector-Wide Selloff

  • Tech stocks led the rout:
    • Apple fell 9.3%
    • Amazon dropped 9.04%
    • Nvidia slid 7.78%
  • Retail stocks were hammered due to tariff exposure:
    • Restoration Hardware collapsed 40.1%
    • Nike fell 14.4%
    • Target declined 10.8%
  • Financials took a major hit as recession fears surged:
    • Bank of America dropped 11.1%
    • American Express fell 9.9%

Technical Analysis of S&P 500

The S&P 500 closed today at 5397, landing precisely on our previously identified support level (green horizontal line). The next 24 hours will be critical — if this level holds, we could see a short-term relief rally. However, the path of least resistance remains lower, with the next significant support zone down at 5245 (yellow horizontal line).

Markets absolutely hate uncertainty, and in this case, Trump’s tariff announcement has likely increased it, not reduced it. Some reasons why?

Mixed Signals

While the tariffs were announced with strong rhetoric, Trump also said he’s open to negotiation. That creates ambiguity. Are the tariffs a firm policy? A bargaining chip? A first move in a longer game? Investors don’t know — and uncertainty leads to risk-off behavior.

Potential for Escalation

Other nations might retaliate, which could trigger a full-blown trade war. The market is pricing in not just what has happened, but what could spiral out from it.

Timing Matters

Markets were already jittery — the Nasdaq had already been sliding — and this announcement poured gasoline on a smoldering fire. Investors are now grappling with the possibility of higher inflation, slower global trade, and a potential recession.

We do not have a crystal ball, nor does anyone else. That is why we rely on the charts and our models. We use technical analysis to tell us the most likely support and resistance levels and right now, we’re sitting at the first major test. If 5397 breaks down decisively, we’re looking to the next key support level at 5245 for signs of stabilization.

Gold surged to an all-time high earlier in the session, fueled by safe-haven demand in response to President Trump’s aggressive tariff announcement. But as the session wore on, many investors took profits, prompting a reversal in prices after the sharp rally.

Selling the Baby with the Bathwater

The broader market meltdown triggered margin calls and liquidity stress for leveraged investors. In such scenarios, gold — being one of the most liquid assets — is often sold to cover losses elsewhere. This forced selling contributed to gold’s intraday decline.

While gold usually benefits from economic and geopolitical uncertainty, today’s pullback appears to be more about short-term volatility than any fundamental shift in sentiment. We continue to view gold as structurally strong and expect it to remain resilient in the coming months.

Technical View

From a technical standpoint, we’re watching for gold to retest the upper boundary of its uptrend channel (red diagonal line) — a former resistance level that now serves as support. It’s likely gold will test this level multiple times, and if it eventually breaks below, we’ll be watching for the next key supports at $3,000 (green horizontal line) and then $2,950 (yellow horizontal line).

Oil prices tumbled sharply today, driven by a combination of demand concerns and unexpected supply increases — creating a ‘double whammy’ for energy markets.

  1. Recession Fears Fueled by Tariffs

Trump’s sweeping new tariffs have stoked fears of a global economic slowdown. A weaker global economy typically leads to reduced energy consumption, placing downward pressure on oil demand.

  1. Surprise OPEC+ Production Hike

OPEC+ added fuel to the selloff by announcing a larger-than-expected output increase of 411,000 barrels per day starting in May. The move caught markets off guard and raised concerns about a potential supply glut.

  1. Rising U.S. Crude Inventories

The Energy Information Administration reported a 6.2 million barrel rise in U.S. crude inventories last week — a sign of weaker domestic demand that further weighed on market sentiment.

Technical View for Oil

Oil closed the day at $66.95, sitting directly at its previously established strong support level (green horizontal line). This marks the seventh time oil has tested this support. With each additional test, the likelihood of this support level breaking increases, as repeated testing tends to weaken the strength of a support zone over time.

Navigate Market Volatility with Confidence

In times like these, uncertainty brings both risk and opportunity. That’s why making smart, informed decisions is more critical than ever.

There’s never been a better moment to subscribe. Our mission is clear: to equip you with trusted insights that help you invest with clarity and confidence—especially when it matters most.

To support you, we’ve reopened our exclusive WOFC 2025 Conference offers, with savings of 33% to 57% off our standard subscription rates. It’s a rare chance to access premium research at exceptional value.

Don’t wait—seize the moment and take control of your financial future.

Click here to claim your exclusive offer now!

—Martin