Markets Tumble as Tariff Shock Sparks Global Selloff
Global stock markets suffered a steep crash today after President Donald Trump announced sweeping new tariffs, triggering one of the worst trading days in years.
Major Index Losses
- Dow Jones Industrial Average plummeted 4%, shedding 1,680 points — its steepest single-day drop since 2020.
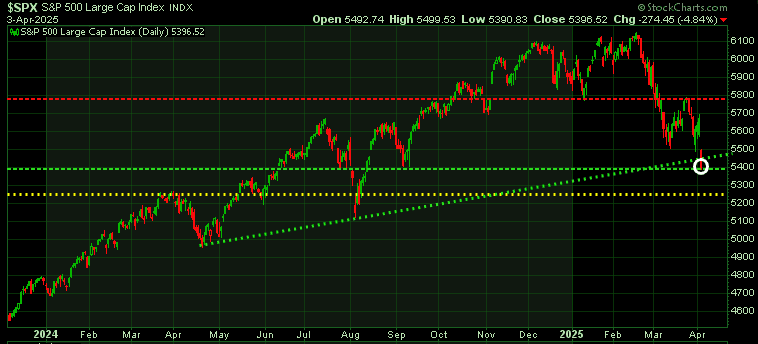
- S&P 500 sank 4.8%, approaching correction territory.
- Nasdaq Composite plunged 6%, officially entering correction territory with a 16.8% decline from its December peak.
Sector-Wide Selloff
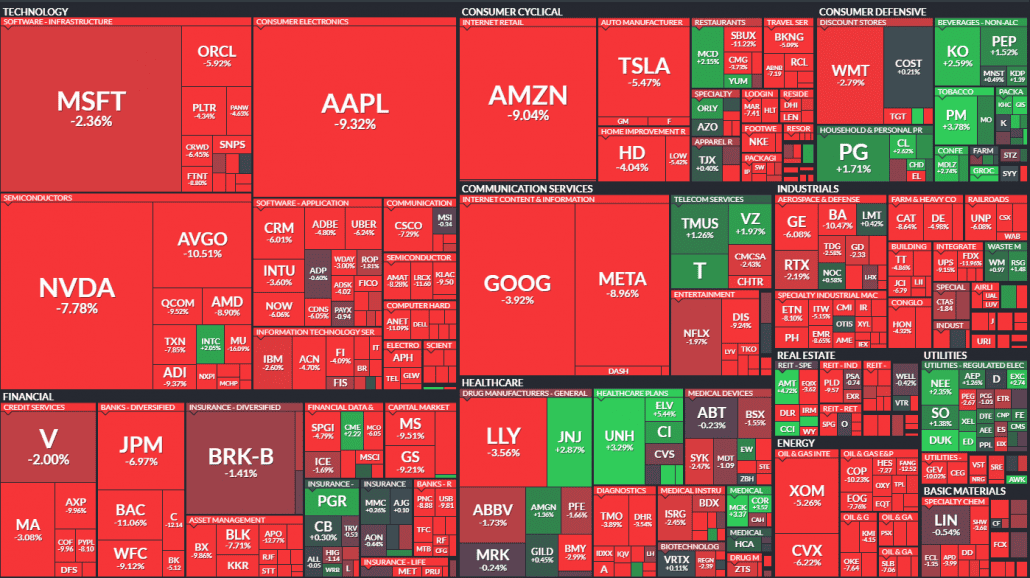
- Tech stocks led the rout:
- Apple fell 9.3%
- Amazon dropped 9.04%
- Nvidia slid 7.78%
- Retail stocks were hammered due to tariff exposure:
- Restoration Hardware collapsed 40.1%
- Nike fell 14.4%
- Target declined 10.8%
- Financials took a major hit as recession fears surged:
- Bank of America dropped 11.1%
- American Express fell 9.9%

Technical Analysis of S&P 500
The S&P 500 closed today at 5397, landing precisely on our previously identified support level (green horizontal line). The next 24 hours will be critical — if this level holds, we could see a short-term relief rally. However, the path of least resistance remains lower, with the next significant support zone down at 5245 (yellow horizontal line).
Markets absolutely hate uncertainty, and in this case, Trump’s tariff announcement has likely increased it, not reduced it. Some reasons why?
Mixed Signals
While the tariffs were announced with strong rhetoric, Trump also said he’s open to negotiation. That creates ambiguity. Are the tariffs a firm policy? A bargaining chip? A first move in a longer game? Investors don’t know — and uncertainty leads to risk-off behavior.
Potential for Escalation
Other nations might retaliate, which could trigger a full-blown trade war. The market is pricing in not just what has happened, but what could spiral out from it.
Timing Matters
Markets were already jittery — the Nasdaq had already been sliding — and this announcement poured gasoline on a smoldering fire. Investors are now grappling with the possibility of higher inflation, slower global trade, and a potential recession.
We do not have a crystal ball, nor does anyone else. That is why we rely on the charts and our models. We use technical analysis to tell us the most likely support and resistance levels and right now, we’re sitting at the first major test. If 5397 breaks down decisively, we’re looking to the next key support level at 5245 for signs of stabilization.

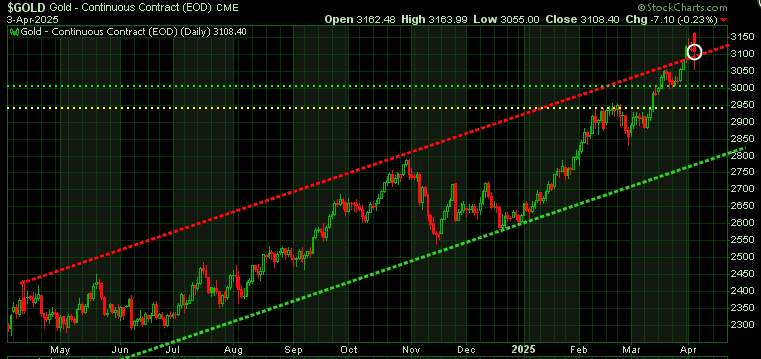
Gold surged to an all-time high earlier in the session, fueled by safe-haven demand in response to President Trump’s aggressive tariff announcement. But as the session wore on, many investors took profits, prompting a reversal in prices after the sharp rally.
Selling the Baby with the Bathwater
The broader market meltdown triggered margin calls and liquidity stress for leveraged investors. In such scenarios, gold — being one of the most liquid assets — is often sold to cover losses elsewhere. This forced selling contributed to gold’s intraday decline.
While gold usually benefits from economic and geopolitical uncertainty, today’s pullback appears to be more about short-term volatility than any fundamental shift in sentiment. We continue to view gold as structurally strong and expect it to remain resilient in the coming months.
Technical View
From a technical standpoint, we’re watching for gold to retest the upper boundary of its uptrend channel (red diagonal line) — a former resistance level that now serves as support. It’s likely gold will test this level multiple times, and if it eventually breaks below, we’ll be watching for the next key supports at $3,000 (green horizontal line) and then $2,950 (yellow horizontal line).

Oil prices tumbled sharply today, driven by a combination of demand concerns and unexpected supply increases — creating a ‘double whammy’ for energy markets.
- Recession Fears Fueled by Tariffs
Trump’s sweeping new tariffs have stoked fears of a global economic slowdown. A weaker global economy typically leads to reduced energy consumption, placing downward pressure on oil demand.
- Surprise OPEC+ Production Hike
OPEC+ added fuel to the selloff by announcing a larger-than-expected output increase of 411,000 barrels per day starting in May. The move caught markets off guard and raised concerns about a potential supply glut.
- Rising U.S. Crude Inventories
The Energy Information Administration reported a 6.2 million barrel rise in U.S. crude inventories last week — a sign of weaker domestic demand that further weighed on market sentiment.
Technical View for Oil
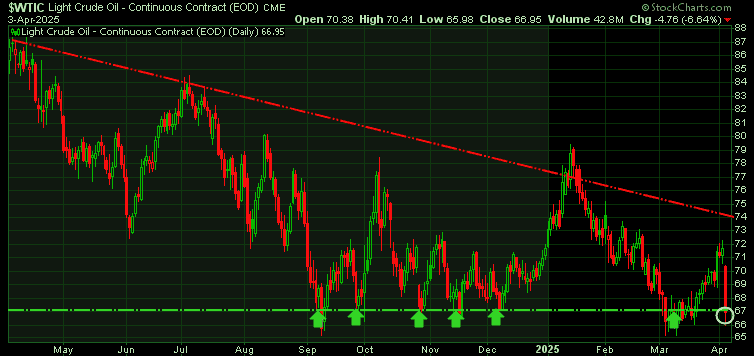
Oil closed the day at $66.95, sitting directly at its previously established strong support level (green horizontal line). This marks the seventh time oil has tested this support. With each additional test, the likelihood of this support level breaking increases, as repeated testing tends to weaken the strength of a support zone over time.

Navigate Market Volatility with Confidence
In times like these, uncertainty brings both risk and opportunity. That’s why making smart, informed decisions is more critical than ever.
There’s never been a better moment to subscribe. Our mission is clear: to equip you with trusted insights that help you invest with clarity and confidence—especially when it matters most.
To support you, we’ve reopened our exclusive WOFC 2025 Conference offers, with savings of 33% to 57% off our standard subscription rates. It’s a rare chance to access premium research at exceptional value.
Don’t wait—seize the moment and take control of your financial future.
Click here to claim your exclusive offer now!
—Martin
