Market Pulse – July 11/25
Market Overview – A Few Charts Worth Watching
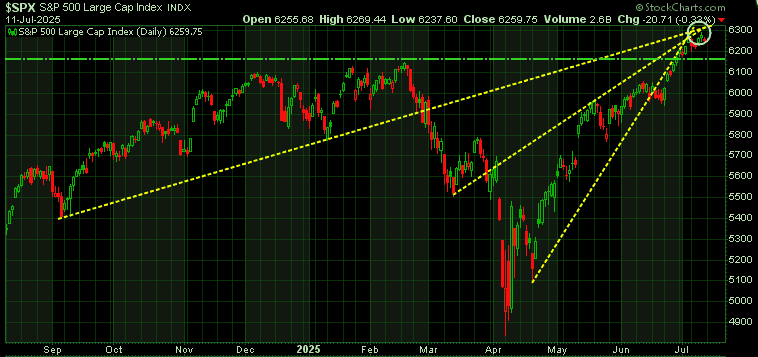
- S&P 500 Pressing Resistance:
The index is testing a key convergence zone, with three short-term resistance levels (the yellow lines) coming into play. So far, it hasn’t been able to break through. A clean move above this zone would be a bullish signal—blue sky ahead. But if the S&P starts to pull back, watch the green horizontal support line. If that fails to hold, a deeper correction could follow.
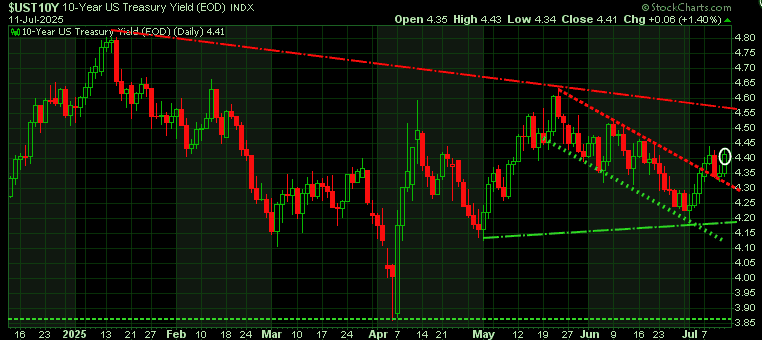
- 10-Year Yield Climbing:
Yields continue to rise ahead of next week’s CPI data. If inflation comes in hotter than expected—potentially reflecting the first effects of the new tariffs—we could see bond markets sell off and yields spike further. This matters because Trump has been leaning hard on Powell and the Fed to cut rates. So far, markets have largely ignored tariff-related inflation risk. A surprise here could shake things up.
Reminder: When markets are priced for perfection, even a small shock can trigger outsized reactions.
- Bitcoin – New all-time high – testing Long-Term Resistance:
Bitcoin hit another all-time high. On the weekly chart back to 2017, Bitcoin is once again testing a key resistance line that’s held multiple times—early 2021, Oct ’22, Dec ’24, and Jan ’25. Today, it finally broke through. If it holds above this level over the next week, a run toward $130K+ is in play. If not, expect a pullback.

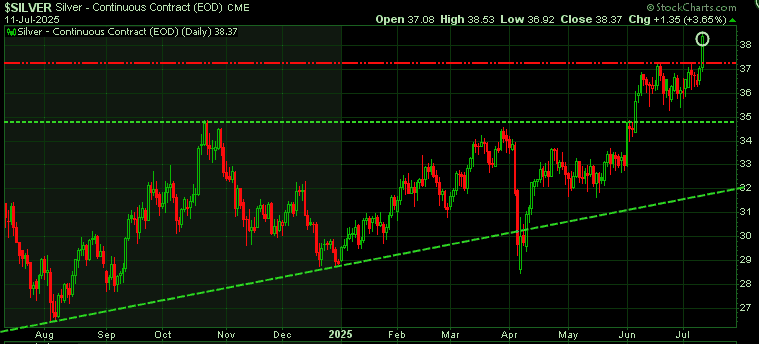
- Silver Breaks Out:
A strong week for silver as it pushes to a 14-year high. While now approaching overbought territory, momentum remains intact. Our near-term upside target is $39. Let’s see if it gets there.
That’s a wrap for now—have a great weekend.
Trend Letter subscribers: your next issue will be in your inbox Sunday evening.
Cheers,
Martin
