Market Pulse – June 13/25
Today’s market action was driven by the ’black swan’ event of Israel attacking Iran. The escalation follows years of mounting tensions, covert operations, and open threats between Israel and Iran, particularly over Iran’s nuclear ambitions and Israel’s repeated warnings that it would act to prevent Iran from acquiring nuclear weapons. Israel’s Operation Rising Lion, launched in the early hours today, targeted Iranian nuclear facilities, military sites, and senior officials, marking the most significant Israeli strike on Iran in decades. The attack killed several top Iranian military commanders and nuclear scientists and was swiftly followed by a large-scale Iranian missile and drone retaliation against Israel.
The market’s reaction was as expected:
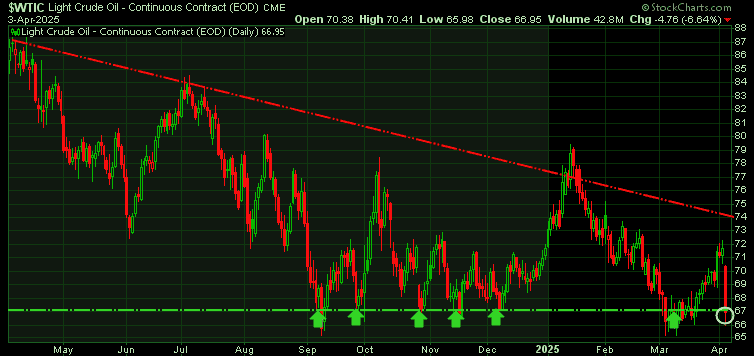
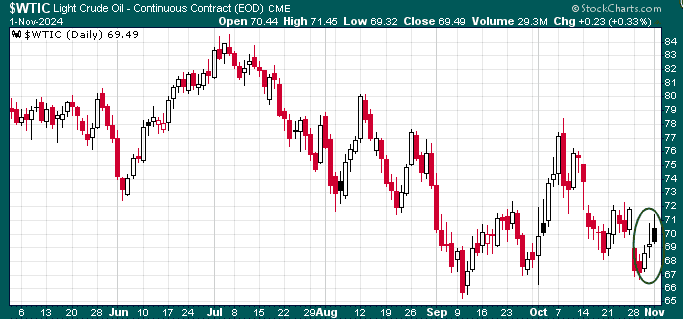
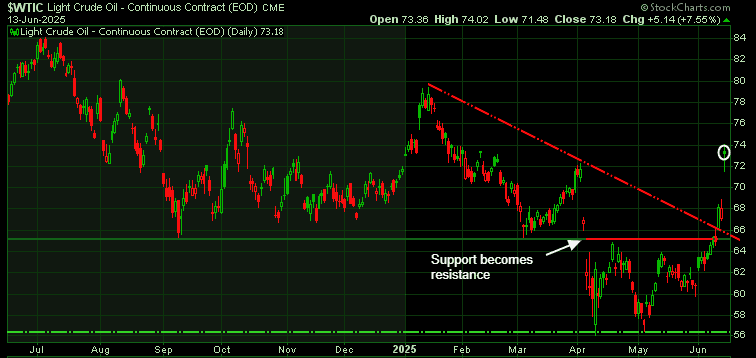
Oil prices jumped sharply, reaching new highs for June and the second quarter—but still below the highest levels seen this year. Traders who were shorting oil have now been forced out. We’ll watch Monday’s trading data for confirmation, but it appears that most of the recent buying has come from commercial players, with very few sellers left. To keep this rally going, the market will likely need stronger evidence that Iran is producing and exporting less oil.
It’s not easy to talk about the current geopolitical tensions without sounding like we’re downplaying their seriousness – and that’s not the intention. The situation is very real, especially for those citizens directly affected and has important implications for global politics. But from an investment perspective, it’s unlikely that the latest headlines from the Middle East will have a major effect on technology spending, corporate profits, or the broader North American economy in the short term. Of course, if the conflict escalates and oil infrastructure is targeted, that could have a more significant impact, and we’re staying alert to that possibility.
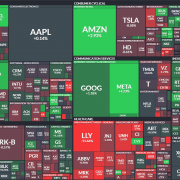
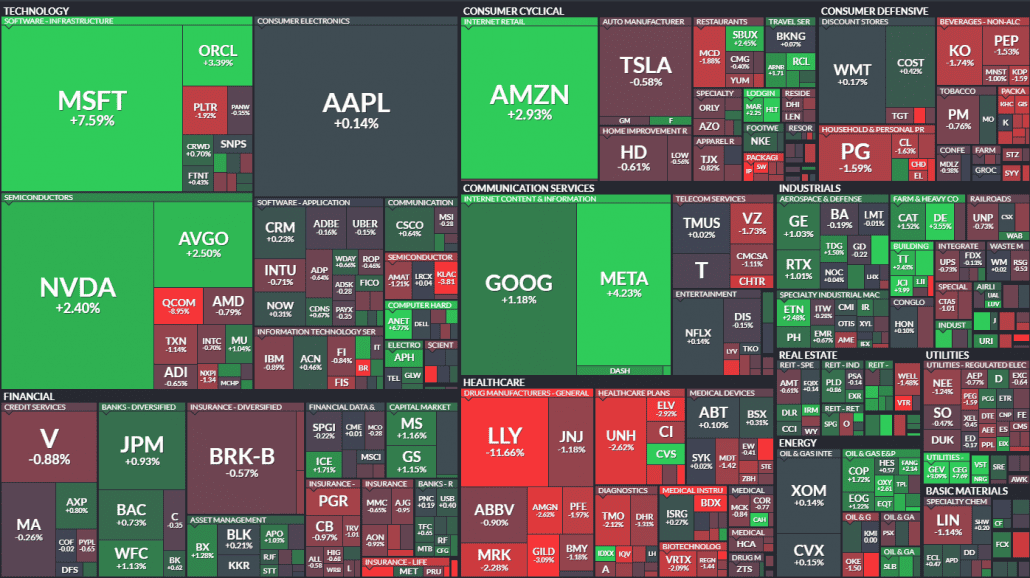
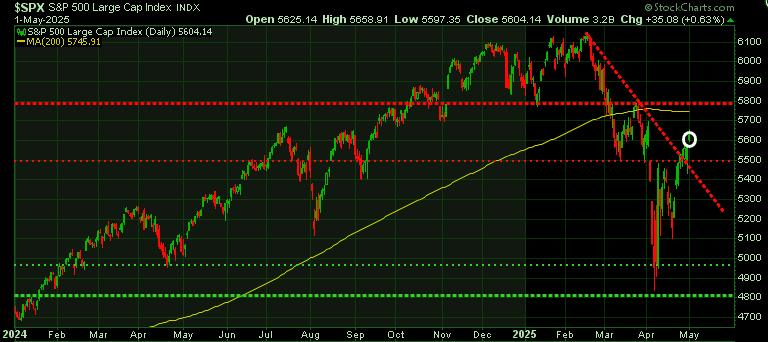
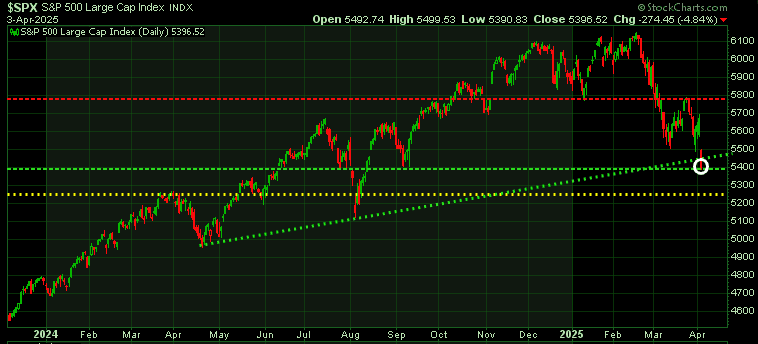
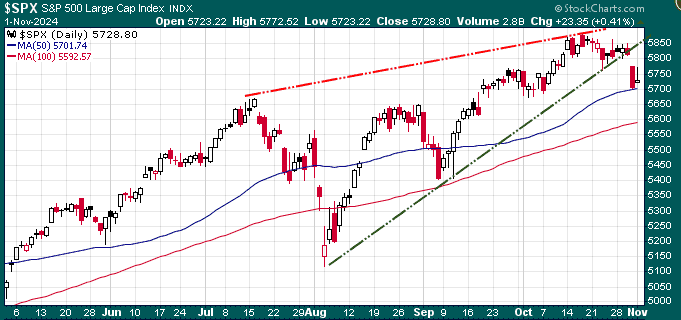
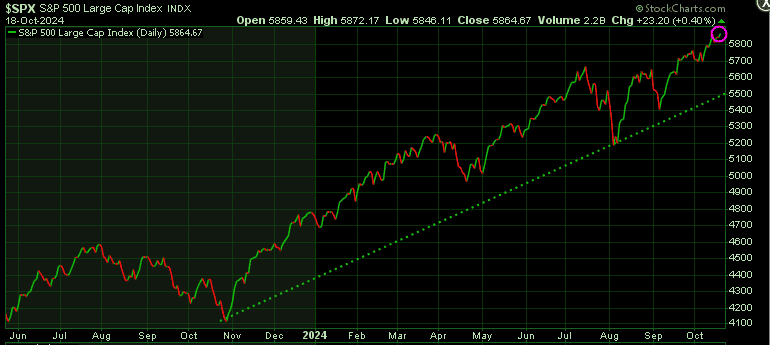
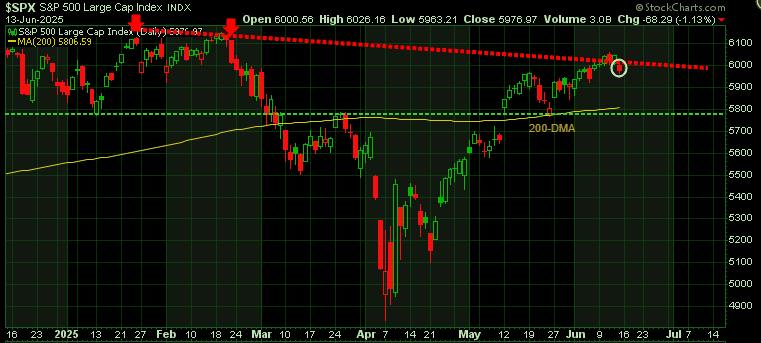
The S&P 500 dipped slightly today, but losses were modest as buyers stepped in to steady the market. Trading volume was the heaviest since early April, with most of the action in the morning – stocks briefly rebounded before slipping again later in the day., closing near the lows of the day.
The late-day weakness makes sense as investors were likely reluctant to hold risk into the weekend given heightened uncertainty. With geopolitical tensions simmering, many preferred to reduce exposure rather than risk being trapped in positions if events escalate while markets are closed.
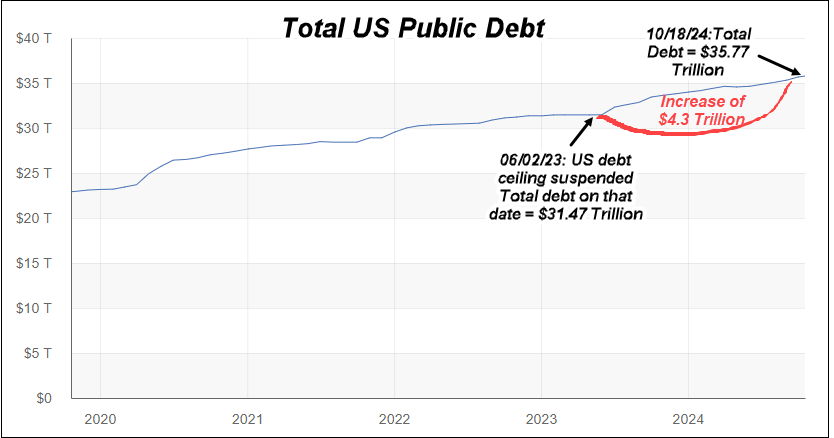
Fundamentals remain shaky. Geopolitical tensions are rising, and the U.S. fiscal outlook continues to raise concerns. While stocks have bounced back since their April lows, enthusiasm around Trump’s energy agenda has cooled after the recent attack on Iran.
Bottom line: The market is holding up – for now – but risks are building, and investors should remain cautious.
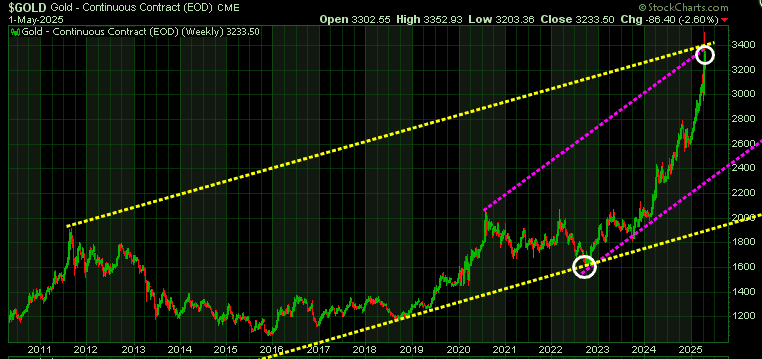
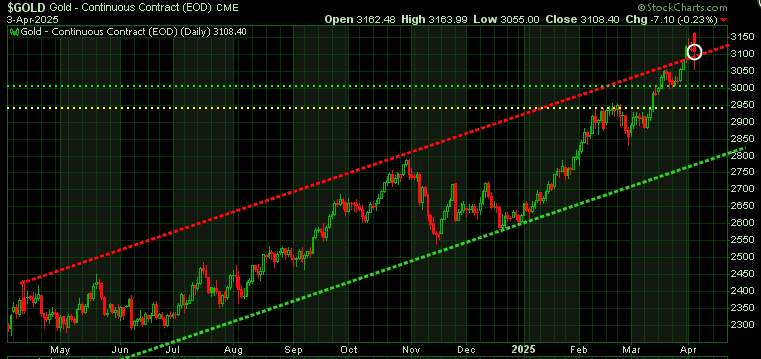
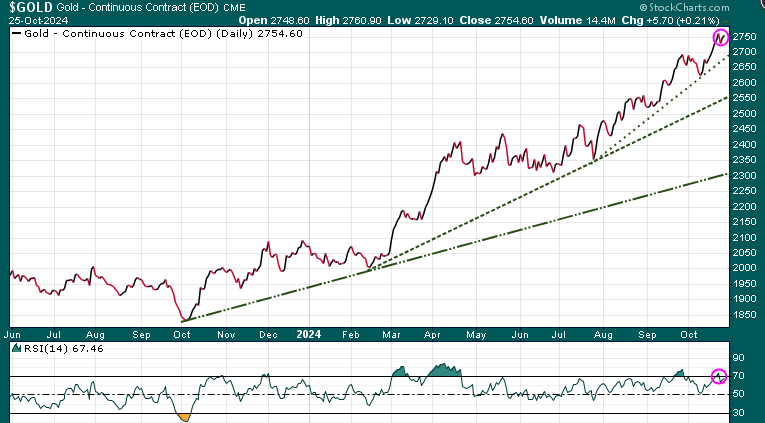
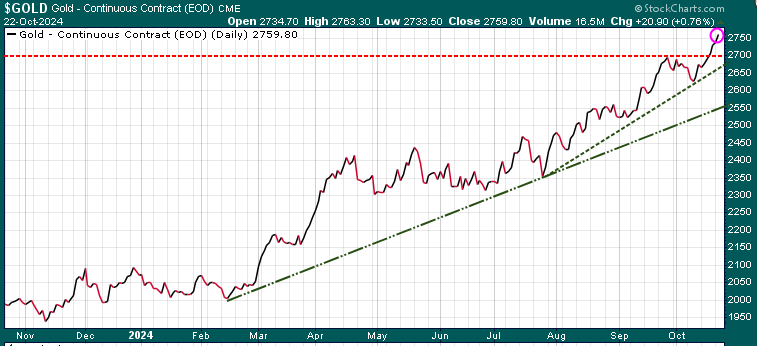
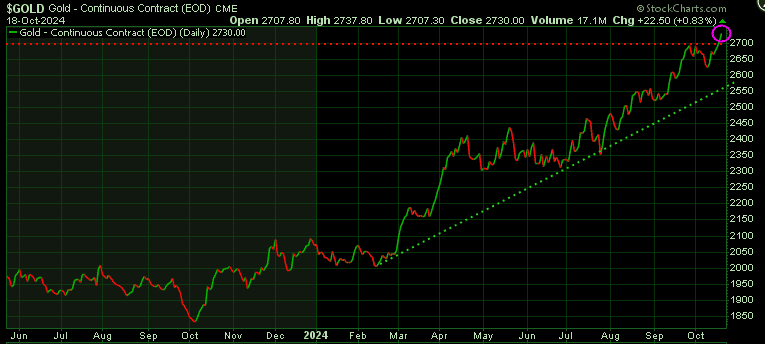
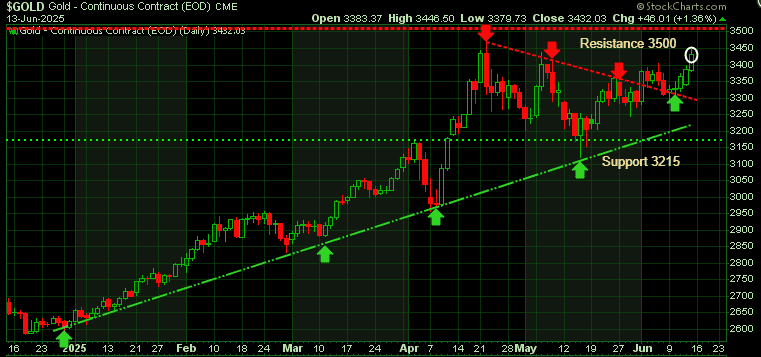
Gold jumped $50 an ounce following news of Israeli strikes on Iran, as investors rushed into safe-haven assets amid rising geopolitical tensions. The escalation sparked fears of broader conflict and potential retaliation, triggering a global move to reduce risk.
Strong demand kept gold prices elevated for the rest of the day, reflecting persistent uncertainty and investor caution. Adding to the momentum were expectations of lower US interest rates, fueled by softer inflation data. Since gold pays no interest, it tends to perform better when rates fall.
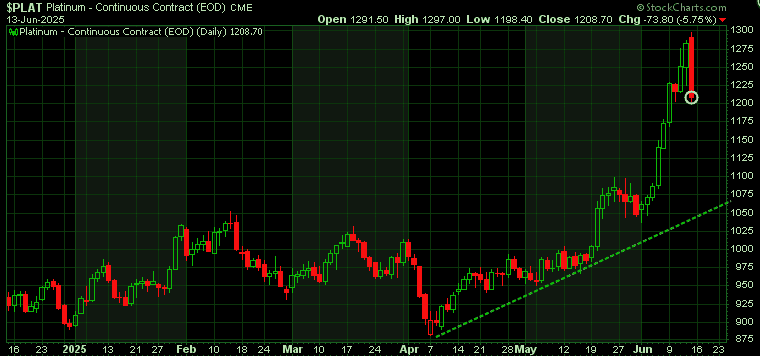
While gold surged $50 an ounce on safe-haven demand, platinum sank $73 (5.75%) in a volatile session, posting an outside day with a bearish engulfing candle. It was the sixth straight day of heavy trading volume. The message from the market is clear: platinum is not being treated as a safe-haven asset – at least not in the same league as gold.
Stay tuyned!