Investing with hedging strategies’ or ‘Hedging’

Markets Now Move at Trump’s Whim

Forget AI hype. Forget earnings. These days, stock prices hang on one thing: what President Trump says next. His words spark chaos, drive momentum, and overshadow everything else.

After announcing ‘reciprocal tariffs’ on April 2, markets plunged for four straight days. Then, at 1:18 PM today, he took to social media to say he’s ‘substantially lowered’ those tariffs to 10% for a 90-day negotiating window. At the same time, he doubled down on China—raising their tariff rate to 125%.

The market reaction? Instant. Explosive. Stocks ripped higher with near-record gains on a massive 30 billion shares traded. It wasn’t earnings, data, or innovation that moved the needle—it was a single post.

Key Highlights:

  • Major Index Performance:
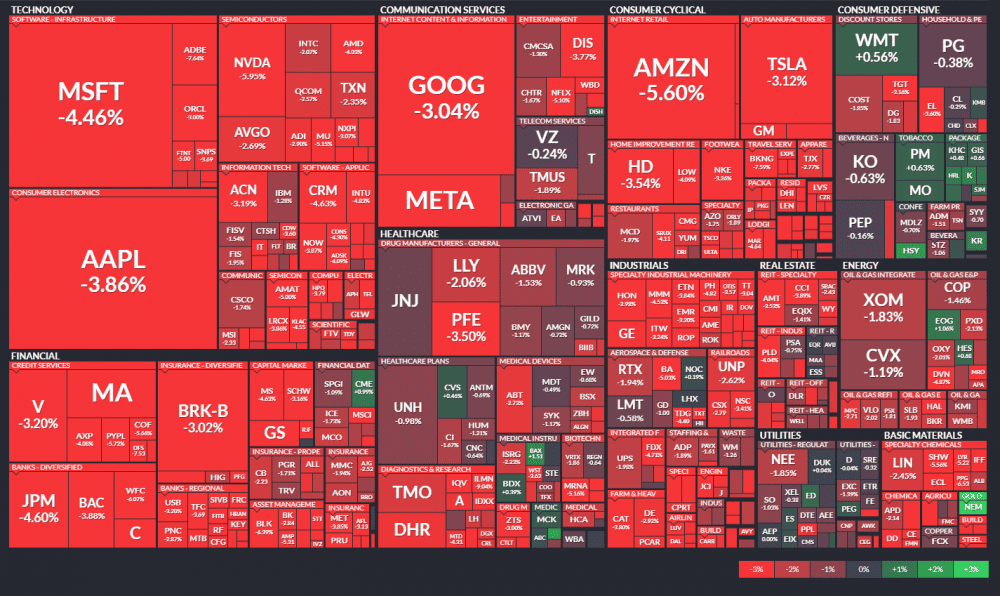
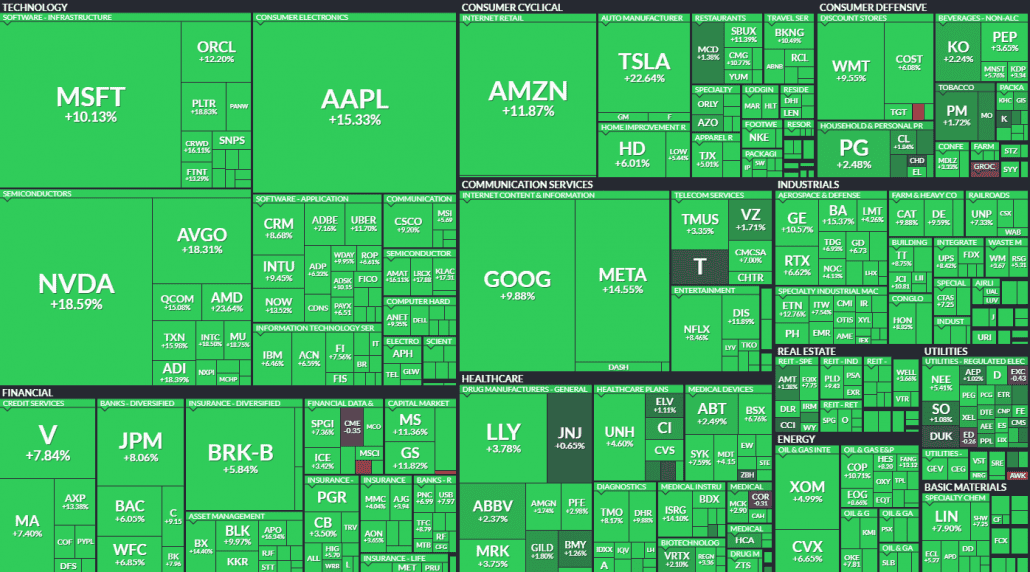
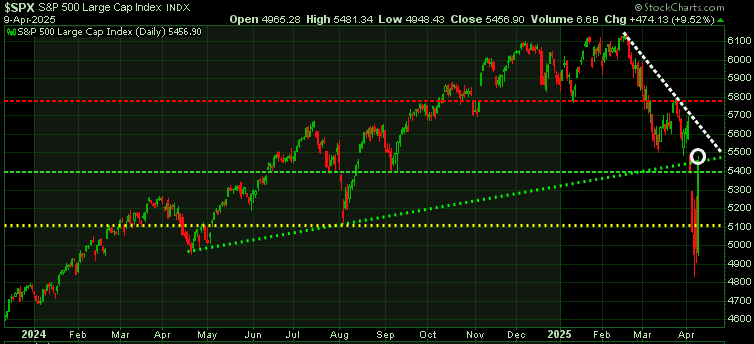
    The Dow Jones Industrial Average surged nearly 3,000 points, or 7.87%, to close at 40,608.45—its largest percentage gain since March 2020. The S&P 500 jumped 9.52% to 5,456.90, notching its best single-day performance since 2008. The Nasdaq led the charge, skyrocketing 12.16% to finish at 17,124.97.
  • Sector Performance:
    Technology stocks fueled the rally, with Apple climbing over 15% and Nvidia surging nearly 19%. Tesla saw a sharp gain of more than 22%. Defensive sectors, including health insurance and defense, also posted solid gains following favorable policy developments.

We’ve reached the point where markets no longer move on earnings, revenue growth, or even AI hype. Now it’s all about what the President says—and the reactions are massive. One post, one offhand announcement, and stocks either soar or sink.

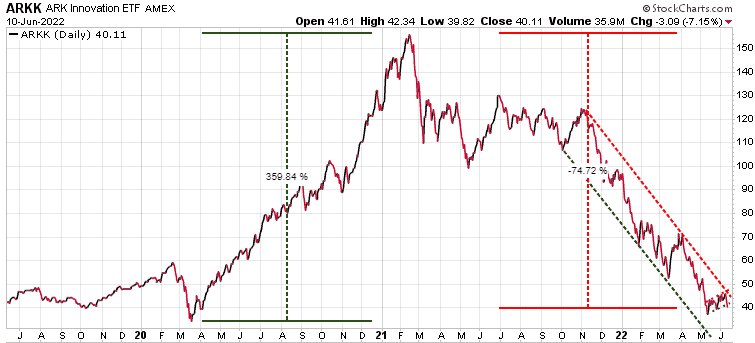
Today’s violent rebound, coming right after a steep selloff, draws uncomfortable parallels to past meltdowns—think the Dotcom Bust or the Financial Crisis—when similar sharp swings masked deeper instability..

Wild Ride: 533-Point Swing Sets Up Key Test

Today’s massive intraday move—from a low of 4,948 to a high of 5,481—was a jaw-dropping 533-point swing. The next key resistance? The white downtrend line, hovering around the 5,500 level.

A Trader’s Dream Day—But Caution Still Rules

Today was a gift for short-term swing and day traders. Some of the biggest rallies happen in bear markets, and this was a textbook example.

While there may be a bit more upside in the near term, uncertainty still looms large—and markets hate uncertainty. Relief rallies can be powerful, but let’s be clear: we’re still in a downtrend – at least for now.  The S&P 500 needs to push through 5500and hold above that level.

Stay tuned!

Recent Hedging Wins Speak for Themselves

Recent Hedging Wins Speak for Themselves

As market volatility continues to dominate the financial landscape, having a reliable hedging strategy is no longer optional—it’s essential. Recent market activity has once again shown the power of using targeted instruments to both protect your portfolio and capture meaningful gains.

Take a look at some of the Trend Technical Trader (TTT)’s recent results that illustrate the effectiveness of these strategies:

EWV – ProShares UltraShort MSCI Japan

Delivered a 22% gain (including dividends)

FAZ – Financial Bear 3x

Produced a 37% gain

TZA – Small-Caps 3x Bear

Locking-in a 27% return

VXX – Volatility ETF

A 15% gain following an earlier position that returned 101% last August

These results highlight how strategic hedging—through inverse ETFs, volatility trades, and sector-specific plays—can not only protect your capital but also deliver strong upside in uncertain markets.

At Trend News, our priority is to help you navigate volatility with confidence by applying tested strategies that manage risk while seeking high-potential opportunities.

Not a Subscriber Yet?

Now’s a great time to join our TTT family.

To help you get started, we’re offering 33% off our regular subscription price—a savings of $250—so you can gain access to the same proven insights and timely recommendations.

Stay tuned for our next round of picks as we continue to adapt and respond to the ever-changing market environment. Click here to view our Special Offer

Chart Alert: Double Top Resistance Signals Potential for Sharp Decline

This is an important chart!

The S&P chart reveals two critical outside reversal weeks down from the 5,700 level—the first ending July 19th and the second just last week, on September 6th. These consecutive reversals in such a short time frame have created a powerful double top resistance.

After the July 19th reversal, we saw a retracement rally to 5,630 before plunging 500 points (~10%) to 5,100 over the next three weeks. We want to caution investors that a similar pattern is very much in play now. Following last week’s reversal, there’s potential for a bounce to around 5,550, but don’t be surprised if that rally falters.

If we reach that 5,500 level, be prepared with your hedging strategies, as the S&P could easily test its 200-day moving average near 5,150. Head on a swivel!

Stay tuned!

If the Fed cuts rates will that be the time to buy stocks?

In last week’s interview on This Week in Money with Jim Goddard, we explored the likelihood of the Fed beginning to cut rates at their September 18/24 meeting and debated how aggressively they would cut. The current rate is 5.50% and according to Fed fund futures,  by the end of 2024, the rate will be 4.16% or 24% lower than it is today. By the end of 2025, that data expects a rate of 2.82%, slightly more than half the current rate.

The stock market, which just came off of all-time highs two weeks ago,  experienced a decline every trading day last week. This stock market is driven by momentum, rather than value.

During my discussion with Jim, I referenced a short video (9:44) I created in December, demonstrating that typically, markets experience a brief uptick when the Fed pauses after raising rates, which we have seen. However, once the Fed starts aggressively cutting rates, stocks sell off.

And this pattern is logical, as rate cuts are typically triggered by economic difficulties and impending recessions, prompting investors to sell stocks due to their vulnerability in such conditions. In the short video, you will see that markets decline, often dramatically, during aggressive rate-cutting periods. Stocks tend to recover and experience strong rallies, only after the Fed ceases cutting rates.

Consider this:  if the Fed embarks on an aggressive rate cut cycle starting September 18, be cautious of mass media pushing for stock purchases. The video highlights a potential risky scenario, akin to a trap. So, keep your head on a swivel. View video

Market Notes

Market Notes – June 17/22

For those wanting to jump in and ‘buy the dip’ be mindful of our constant warnings that ‘bear market rallies typically fail to make new highs, and instead often make new lows.’

According to Bank of America ‘The average peak to trough bear decline = 37.3%, average duration 289 days; history is no guide to future performance but if it were, today’s bear market would end on Oct 19, 2022 (35-year anniversary of Black Monday) with S&P 500 at 3000.

The S&P 500 has dropped through the 38% fibonacci retracement level at 3838 and is approaching the 50% retracement at 3534.

A few months ago we targeted mid-year as a potential top for commodities. We are seeing food, lumber, even gasoline and oil coming down this week. Could the top be in?

Here is the Reuter CRB Commodity Index and it has started to roll over. Watch the 296 level (green horizontal line), which was the May low; a break below that level would be bearish. Understand that long-term we are very bullish commodities, but if we are heading for a recession then commodities will be hit as well. Once the bottom is in, we will be sending out BUY signals to subscribers.

Michael Hartnett of Bank of America notes that Fed tightening ‘always breaks something’ with the US recession likely the last leg lower in this bear market. Looking at the their Bull & Bear indicator we can see that it has dropped right down to zero, which is quite extreme. This is a contrarian indicator suggesting one of those bear markets rallies should kick off next week.

Another sign a recession likely coming as manufacturing took a big hit last month.

And yet another negative piece of news. ‘Global profit expectations among money managers are tumbling, another sign that Wall Street is at a crisis point’, according to BofA Securities. In their June Fund Manager Survey of 800 panelists with $834B under management, a net 72% say corporate profits will worsen, the lowest reading since the collapse of Lehman Bros. in September 2008.

There is a term called the ‘wealth effect.’ It refers to how homeowners and investors feel when housing prices and the value of their stock portfolios go up in value; they feel wealthy and therefore are willing to spend more. Consumers account for ~70% of the GDP, so when they spend more, it is good for the economy. Of course the reverse is also true, when house prices and stocks fall in value, consumers spend less and the economy slows.

Various indicators continue to portray extreme bearishness, which in a bull market would be a solid BUY signal. But, this is not a bull market, so we need to show caution here. If you have not yet put on any hedge positions, use this next relief rally to do so. Trend Technical Trader (TTT) uses simple inverse ETFs for hedging and offers subscribers many options; there is something for every investor. Click here to subscribe to TTT at a 50% discount

Market Notes

Market Notes – June 10/22

US stocks sank Friday as investors digested two downbeat prints on the US economy.

May data on inflation showed price increases unexpectedly accelerated last month, with consumer prices rising 8.6% year-over-year in May, the most since 1981. Consumer sentiment data released Friday morning came in at a record low, as inflation weighs on American households.

The S&P 500, Dow and Nasdaq dropped sharply following the print. The S&P 500 sank by 2.9% during the session, and by more than 5% since last Friday to post its worst weekly performance since January. The index ended just a hair above 3,900, or its lowest level in about three weeks. The Dow sank by 880 points, or 2.7%, and the Nasdaq Composite dropped 3.5% by the end of Friday’s session.

The S&P 500 is back to testng its previous low and if that level does not hold, we could see a significant decline.

Note that Trend Letter subscribers were given a new BUY recommendation on an insurance play this week. These insurance plays, or hedges are critical to protecting your wealth in a bear market. Our hedging service Trend Technical Trader (TTT) has a number of hedging options and subscribers can decide which one suits their specific trading strategy.  If you do not have a hedging strategy, seriously consider subscribing to TTT at a 50% discountClick here to subscribe to TTT

Consumer sentiment has dropped to a record low.

A sea of red.

Cathy Wood’s ARKK ETF was the darling of the Tech sector after the Covid crash, having soared ~360%. In this bear market since the high in Feb’21, it has given up ~75%.

Stay tuned!