Markets in Motion: S&P 500 & Bitcoin in Focus
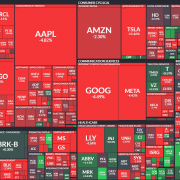
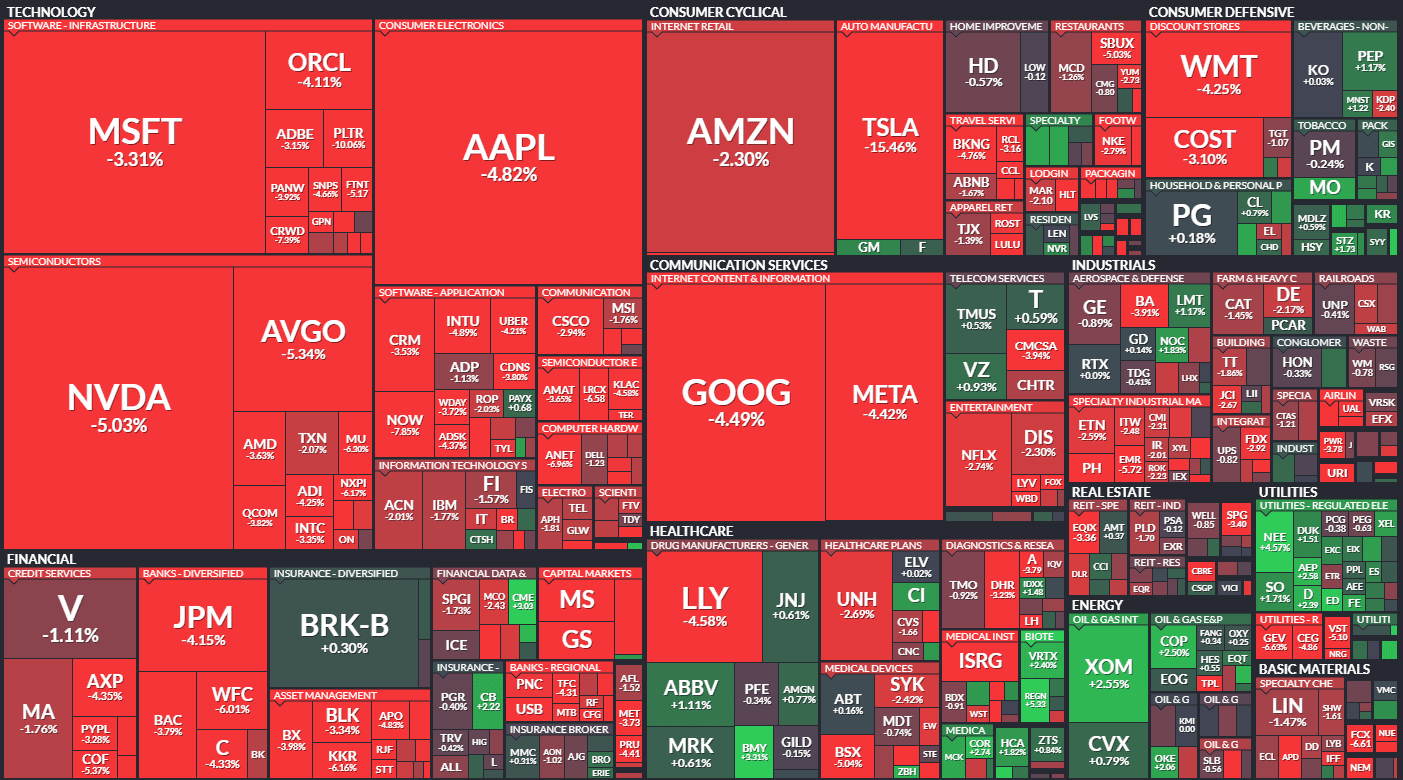
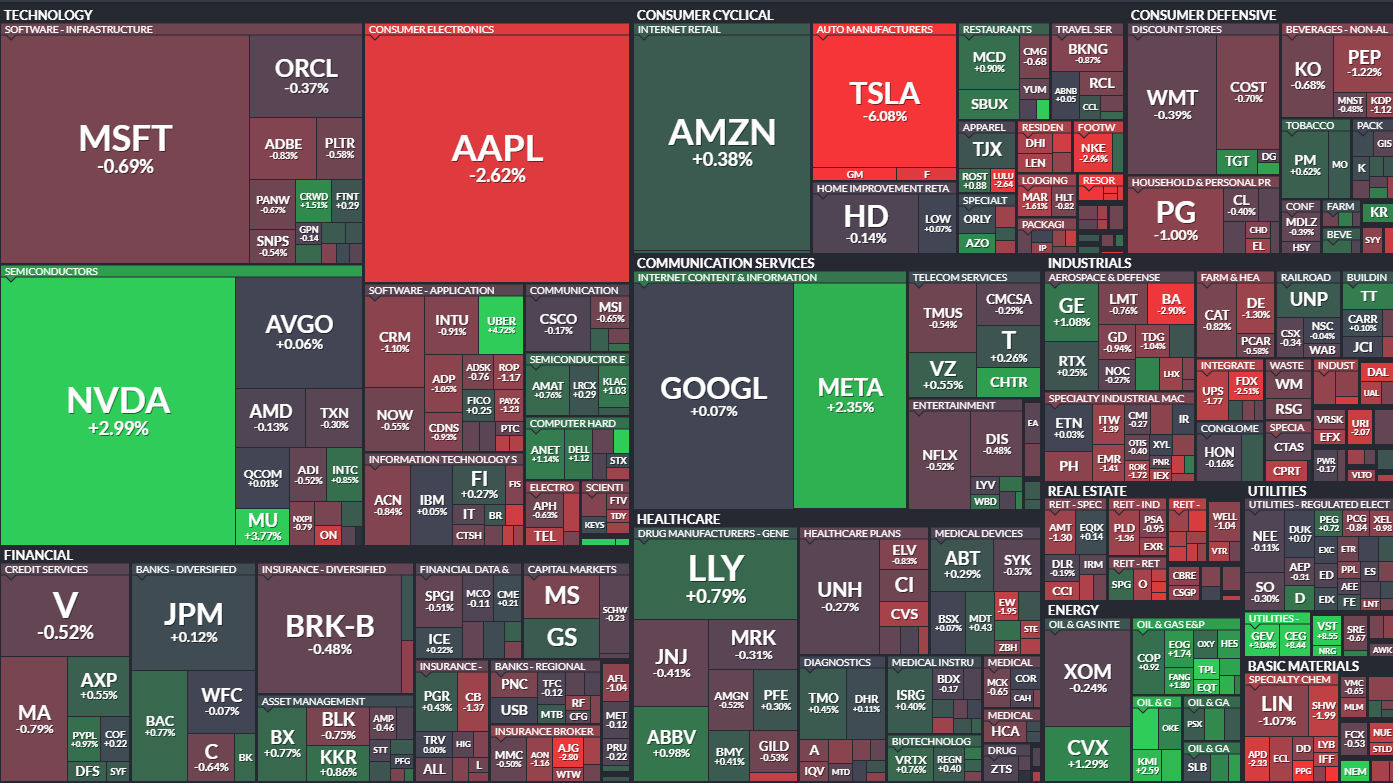
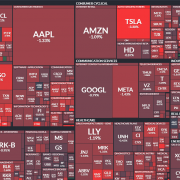
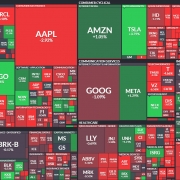
Following up on yesterday’s update, the S&P 500 closed lower again today, though the decline was far less severe than yesterday’s bloodbath. Some of the Magnificent 7 stocks actually closed in the green today.
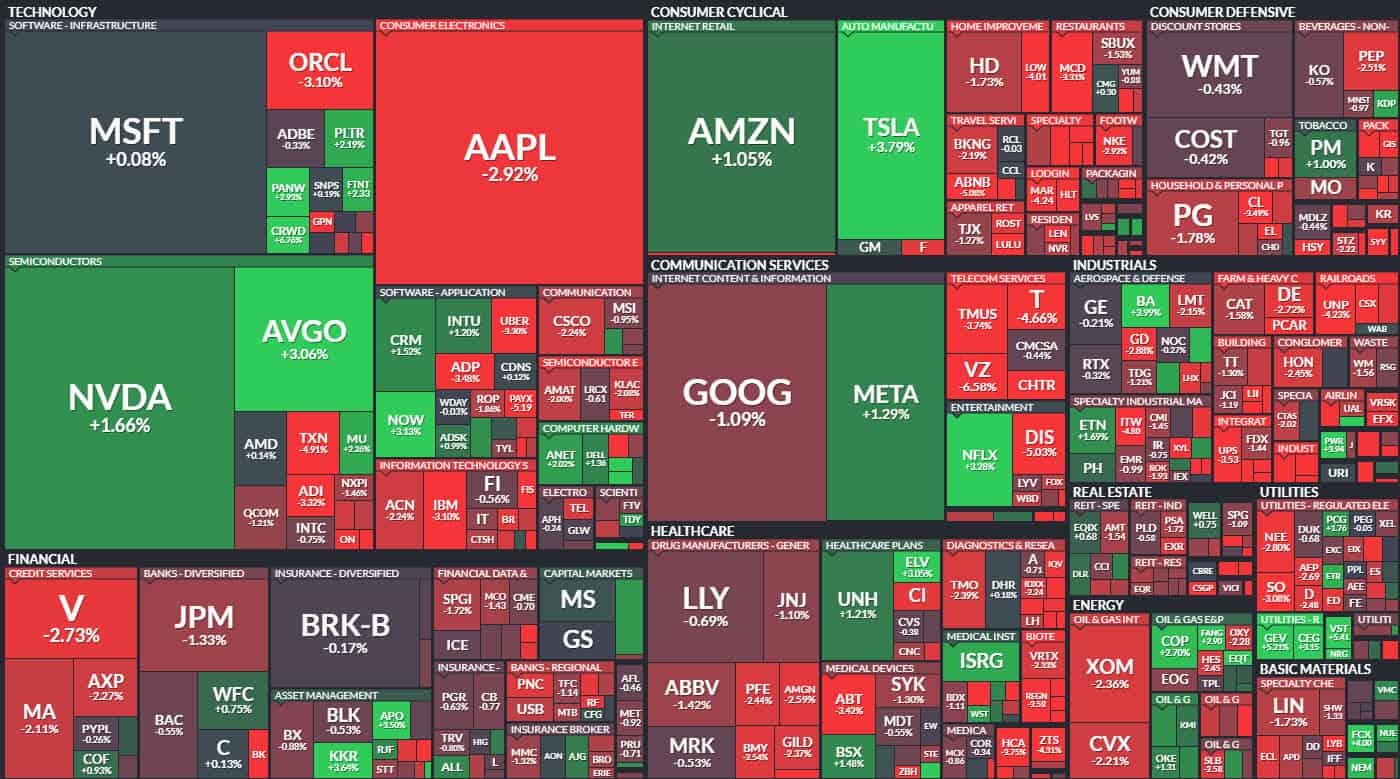
The market downturn continues to be driven by escalating trade tensions between the United States and Canada. President Trump initially announced an additional 25% tariff on Canadian steel and aluminum imports—raising the total to 50%, effective Wednesday. However, reports emerged near the time of this writing that Ontario is suspending its 25% energy surcharge on exports for US electricity and that Trump will delay the tariff increase, keeping it at 25%. These constant shifts in trade policy have made equity markets increasingly volatile and uncertain.
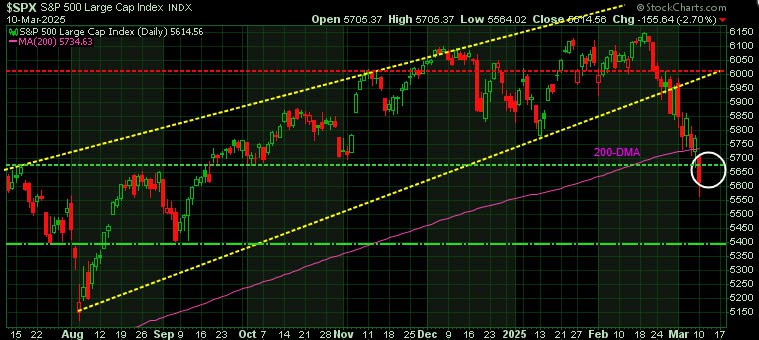
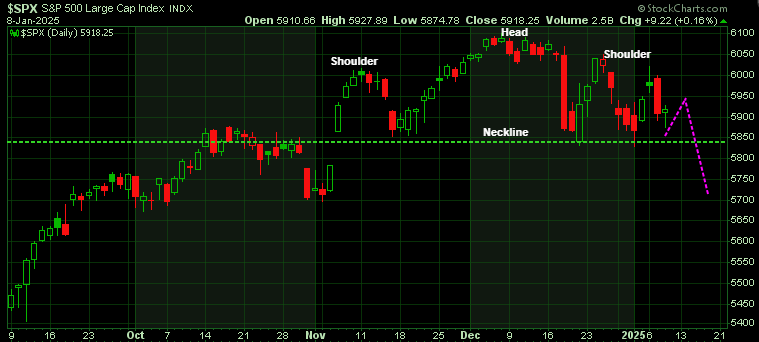
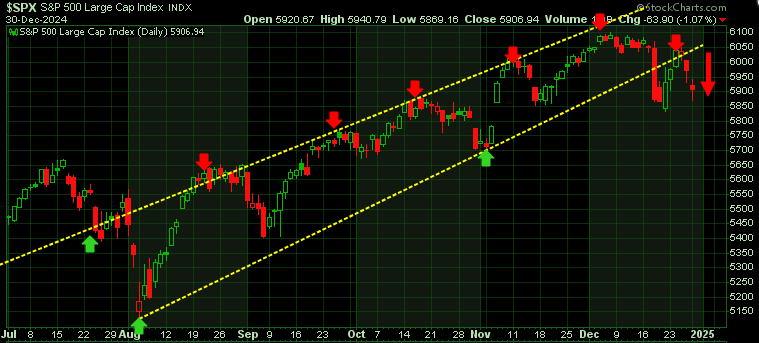
Technical Analysis of the S&P 500:
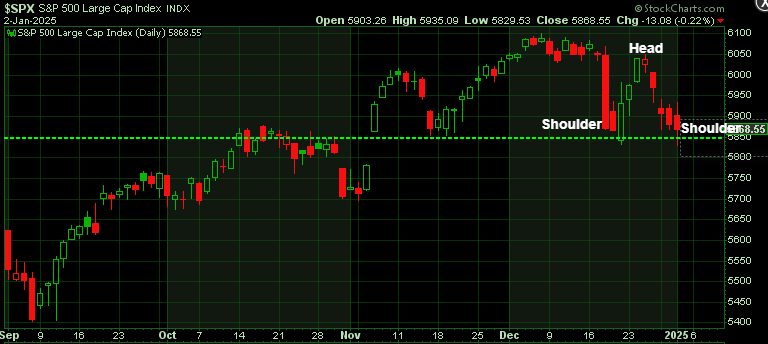
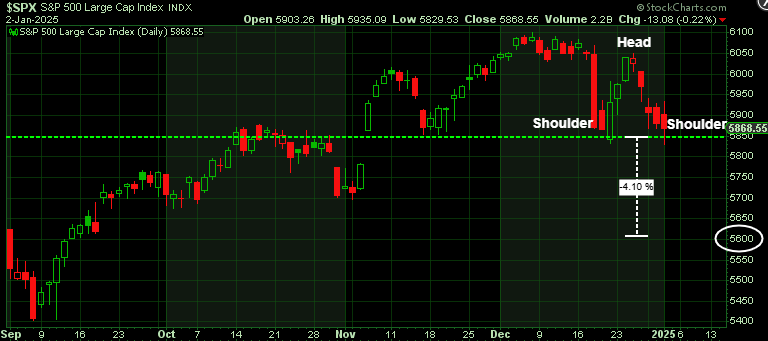
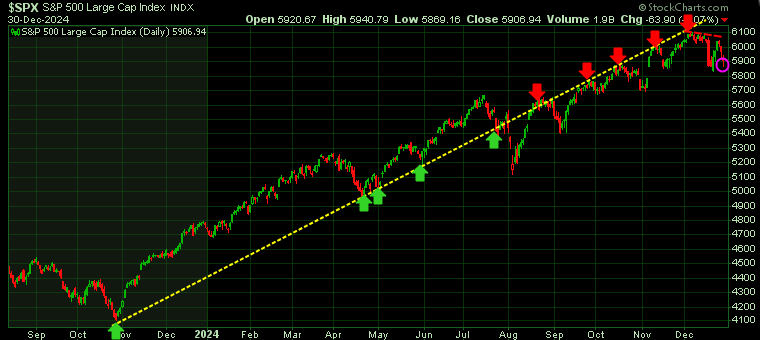
The S&P 500 failed to regain its previous support level at 5,670 (green horizontal line) and instead closed down 42 points to 5,572. As highlighted in yesterday’s update, this failure to rally above 5,670 confirms the current bearish tone. If this pattern persists, the next key support level is just below 5,400 (second green horizontal line).
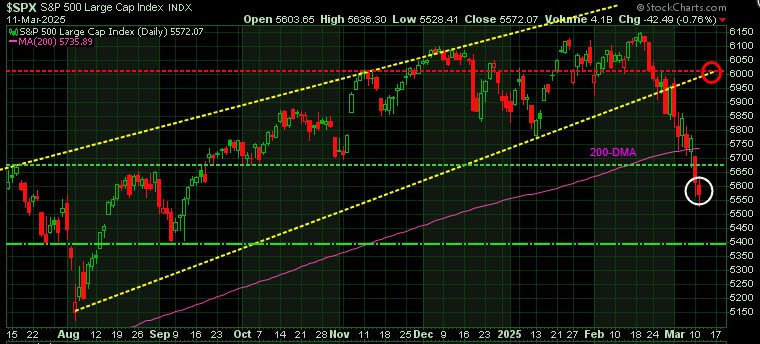
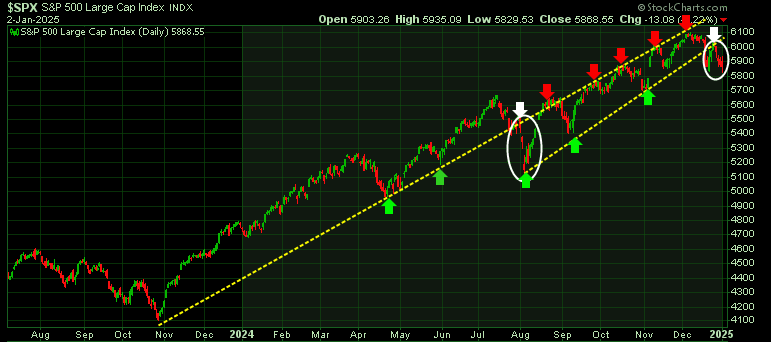
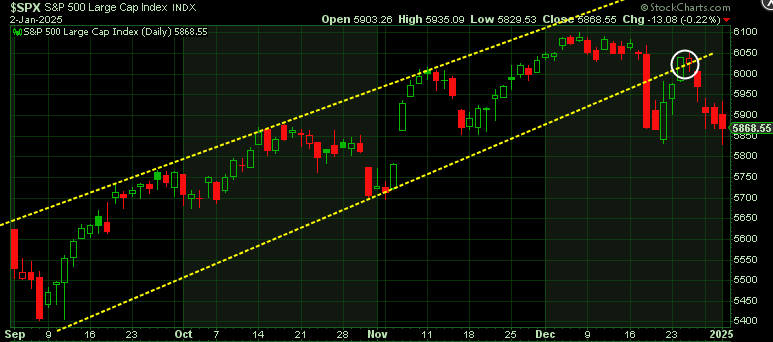
If the S&P 500 can rally and close back above 5,670 tomorrow, a short-term rebound may be possible. While this wouldn’t necessarily signal the market’s ultimate bottom, it could indicate a relief rally. For a more sustained recovery, the index would need to reclaim its position within the uptrend channel (yellow lines) that it fell out of two weeks ago. This would require a rally back to the 6,000 level (red horizontal line, and red circle).
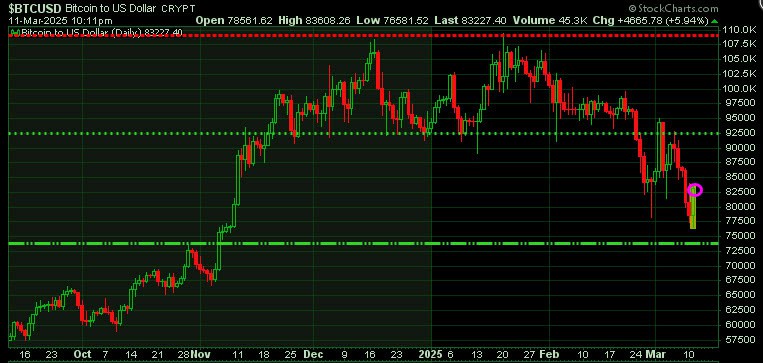
Bitcoin Update:
Bitcoin broke through its key support level at 92.5K in late February and dropped to a low of 75.4K today before rebounding to 83.2K at the time of this update. While bitcoin is highly volatile, it often serves as a strong indicator of broader market sentiment. A rally in bitcoin suggests a risk-on sentiment in speculative sectors, while a decline signals a risk-off market environment.
Our models indicate that bitcoin could rally back up to the previous 92.5K support level, which will now act as initial resistance. If that resistance holds, bitcoin could fall back toward our target support level of 73K (bottom green horizontal line).
Navigating Market Volatility
Both Trend Technical Trader and Trend Letter anticipated these sharp market declines and issued hedging positions in advance to safeguard subscribers.
If you’re looking for guidance in navigating these volatile markets, now is an opportune time to subscribe to our services. Our mission is to help investors make informed decisions during uncertain times.
To support this, we’re reopening our Special Offers from the WOFC 2025 Conference, providing 33%–57% off regular subscription rates. Click here to take advantage of these exclusive discounts!
Stay vigilant and be ready to adapt—spotting trend changes is what we do!
Martin
Trend News