
S&P 500 update: Watch for resistance at 2490-2515
Mariam Webster’s definition of Complacency: marked by self-satisfaction especially when accompanied by unawareness of actual dangers or deficiencies : marked by complacency : self-satisfied a complacent smile
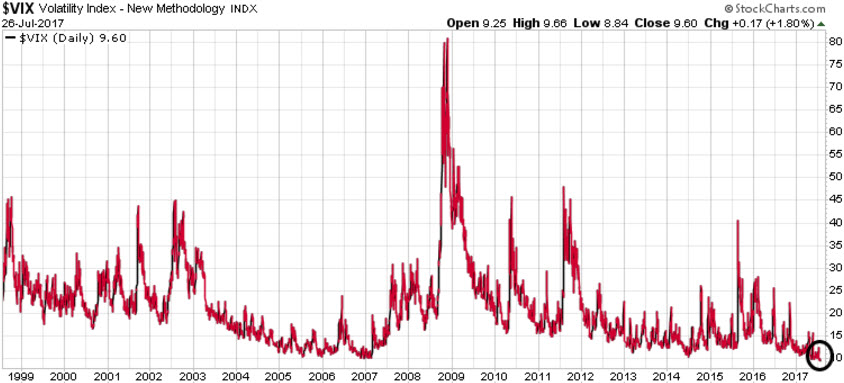
The VIX volatility Index measures the market’s expectation of 30-day volatility. It is constructed using the implied volatilities of a wide range of S&P 500 index options. This volatility is meant to be forward looking, is calculated from both calls and puts, and is a widely used measure of market risk, often referred to as the “investor fear gauge.”
A VIX reading above 30 indicates that investors are nervous, fearful, and risk-averse, concerned that the markets will decline. While readings under 20 indicate that investors are complacent, risk-tolerant, and optimistic that the markets will run higher. As we can see on the VIX charts below, investors are more complacent/optimistic today than at almost any other time in history.
Another indicator that we need to pay attention to is that the S&P 500 seldom deviates more than 7% from its 200-day Moving Average. As we can see on the following chart, once the S&P 500 deviates up or down more than 7%, we tend to see a correction the other way. Today the S&P 500 is trading at 6.91% higher than its 200-day MA, suggesting a correction is coming.
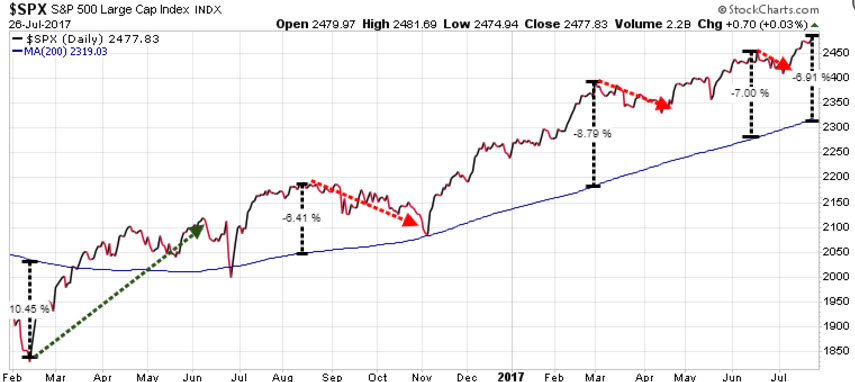
In January we noted that once the S&P 500 closed above 2300 that 2500 was the next target. We identified the 2490-2515 range as a Key Resistance level for the S&P 500. With the S&P 500 currently trading just south of 2480, we are getting close to a strong resistance area for the markets. We would expect to see a Near-term high for the S&P 500 in the next few weeks.
We have continued to ride the market’s methodical rise higher, but recently sent subscribers a new pending trade (our entry price has not yet been hit) to profit should the markets decline here.
Numbers to watch:
- 2490-2515 Near-term high
- Potential for a quick decline to 2400-2415
- A breach of 2400, although not expected, opens the door for a further decline to 2300
- After declining to 2400, look for a new rally through 2500, then 2650
- Another decline from 2650 to 2500
- Then a year-end rally to close the year between 2700-2900
Subscribers to The Trend Letter will receive Flash Alerts when our model signals new buying opportunities.
Note: If you are not a current subscriber and want to get on the list to receive all of our weekly reports + our Flash Alerts, we our offering you a very Special Offer to receive The Trend Letter for only $369.95, a $230 discount off our regular rate. Click here to take advantage of this Special Offer.
Stay tuned!