
Markets keep rising…do you have an exit strategy?
The current bull market continues its record breaking run. Consider the following:
- 2017 was the first year in history where US stocks ended every single month in the green.
- Bank of America reports that $58 billion flowed into equities in the latest 4-week period, an all-time high.
- The Dow rallied 1,000 points in just 8 trading days, a new record.
- The Dow is up 8,000 points since the Trump election victory, while the S&P 500 is up 35% since the election.
- Since the Trump election, the financial Sector ETF is up 45%
- There hasn’t been so much as a 3% pullback in over a year.
- Apple says it will pay $38 billion in taxes to bring back its $252 billion of cash held overseas because of tax reform.
- Apple will also invest $30 billion in capital expenditures in the US, & create 20,000 new US jobs.
But as this bull market rages on, seemingly without resistance, we need to be aware of a number of warning signs that this market is overheated. Let’s have a look at 4 of the warning signs that we have been highlighting to our Trend Letter subscribers:
- The first indicator we will look at is the Relative Strength Index (RSI), which is a momentum indicator that compares the magnitude of recent gains and losses over a specified time period to measure speed and change of price movements of a security. It is primarily used in an attempt to identify overbought or oversold conditions in the trading of an asset.
When an asset sees its RSI drop below 30, it is considered to be in “oversold” territory, suggesting that the asset may be due for a rally. The opposite is true, too. When we see an asset rise faster than normal, and its RSI moves above 70, it is considered “overbought,” suggesting it is a time for caution, signalling that a correction may be coming. As we can see on the bottom of the chart below, the S&P 500’s RSI reading was at 87.39, an all-time high level, even higher than at the dot-com bubble of the late 1990s.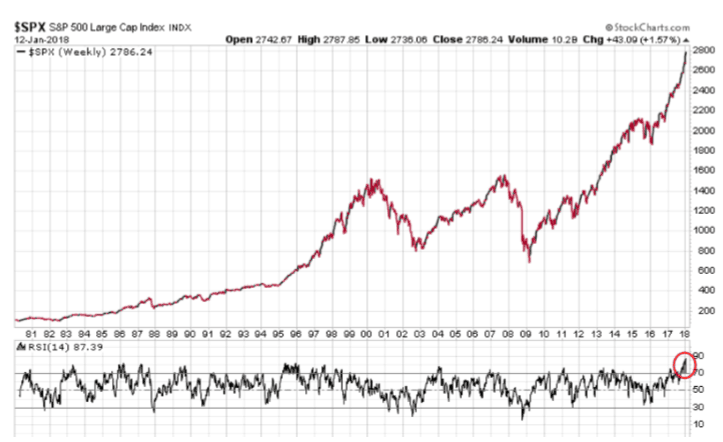
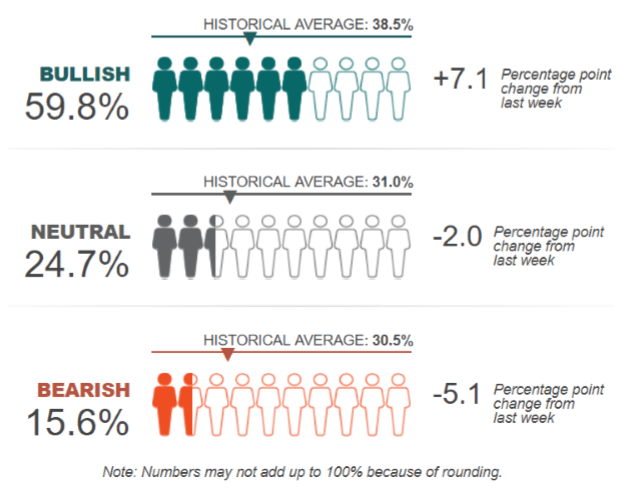
2. The second indicator that we look at is the American Association of Individual Investors (AAII) Sentiment Survey. The historic average of bullish sentiment is 38.5%, but the reading last week was almost 60%, with only 15.6% bearish, a reading that is clearly suggesting caution.
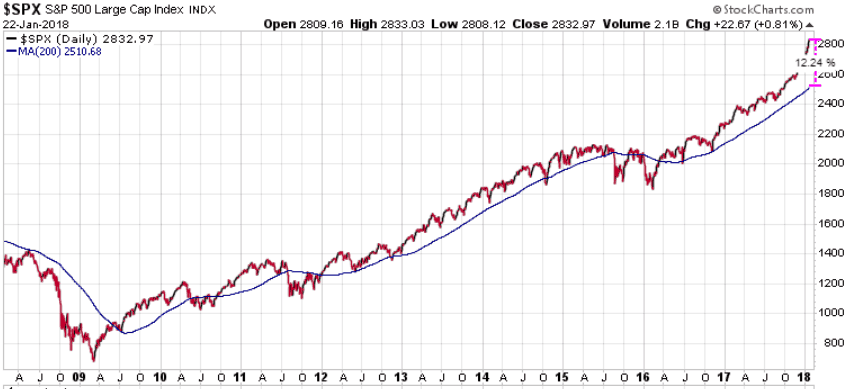
3. The third indicator is the 200-day moving average (DMA). The markets generally trade within 8% of their 200-DMA. In bull markets, they tend to trade above this 200-DMA, while in bear markets, they trade below the 200-DMA. Whenever markets trade outside of that 8% range, they tend to revert back toward that 200-DMA. As you can see, the S&P 500 is currently over 12% above its 200-DMA, suggesting it is very overbought and should at least cool down to fall within 8% of that 200-DMA.
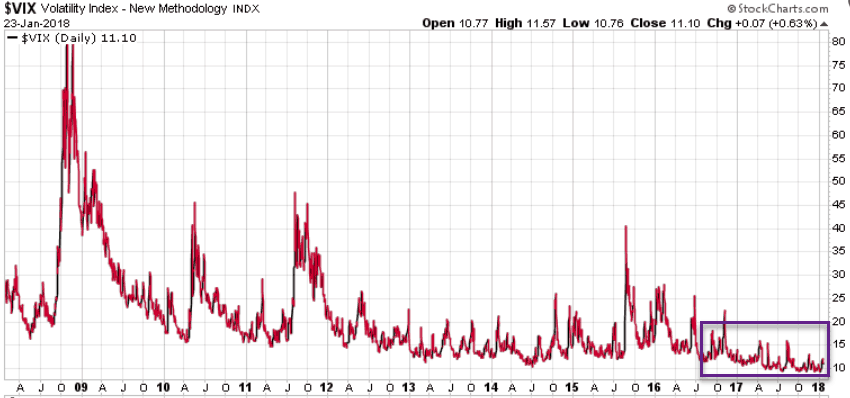
4. The fourth indicator is the VIX Volatility Index, also known as the “fear index.” The VIX looks at expectations of future volatility, also known as implied volatility. Times of greater uncertainty (more expected future volatility) result in higher VIX values, while less anxious times correspond with lower values. A reading above 20 suggests that investors are “complacent, with a “risk-on” sentiment. Conversely, a VIX reading over 30 suggests investors are getting “fearful,” with a risk-off sentiment.
As we can see on the chart below, the VIX reading has been below 20 for all of 2017, and only popped above that level once since June of 2016. This implies that investors are all-in, suggesting the markets are overbought.
Now because all of these indicators are warning that this market is overbought, it doesn’t mean it cannot keep rising, it just means you need to be prepared for a pullback, or a more severe correction. You need an exit strategy! What we are saying is that prices are elevated, as are the risks, as the masses are taking on increased risk. This tells us we need to be prepared for a pull back or a more severe correction.
While The Trend Letter does have some “insurance” plays pending, Trend Technical Trader (TTT) is a hedge service, designed specifically to protect, and even significantly grow your wealth on a market decline.
Good deal – We are offering you TTT at $250 off the regular price of $649.95, now just $399.95. Click here to take advantage of this offer.
Great deal – We are offering both The Trend Letter & Trend Technical Trader at $600 off the regular price, now just $649.95. Click here to take advantage of this offer.
Stay tuned!