
Stock Market
Since falling almost 20% from late September through to December 24, S&P 500 has rallied over than 16% to date.
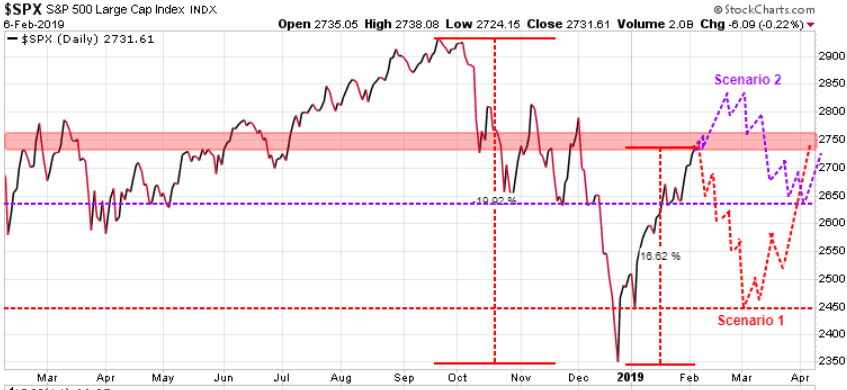
For the past month we have been highlighting how the 2725-2760 range is a Key Near-Term Resistance level for the S&P 500. We are now in that range and we wanted you to see two potential scenarios that our models are projecting.
The first scenario (in red) sees this current rally ending in this range and then declining back down to the 2450 level we saw in early January. Note that in this scenario there is the risk of correcting further to re-test the December 24th low at 2350.
In the second scenario (in purple) the model projects that the S&P pushes through this resistance range at 2725-2760 and breaks through to test the 2830 level. At that point though we are looking for a double top and then also a sizable correction, but not as large as the correction in scenario 1. In this second scenario we are looking to test support at the 2640 level.
Note that in both scenarios the projections are for these lows to be the low for this cycle and we would then be looking for the S&P to begin a new rally.
We will update further in Sunday’s issue of the Trend Letter.
Stay tuned!