Market Charts – March 3/22
(From Yahoo finance)…The S&P 500 index fell 0.5% during the regular trading day as technology and growth stocks came under renewed pressure, and the Nasdaq Composite dropped nearly 1.6%. Treasury yields steadied after sliding earlier this week, and the benchmark 10-year yield hovered above 1.8%.
A fresh set of economic data due for release Friday morning is expected to reaffirm to investors that the U.S. economy has recovered sufficiently to allow monetary policymakers to ease their crisis-era supports. The Labor Department’s February jobs report is expected to show a fourteenth consecutive month of payroll gains, with jobs rising by more than 400,000 and the unemployment rate edging lower to 3.9% — or the lowest since February 2020 before the pandemic. Such a result would mirror the much better-than-expected private payrolls data out from ADP earlier this week.
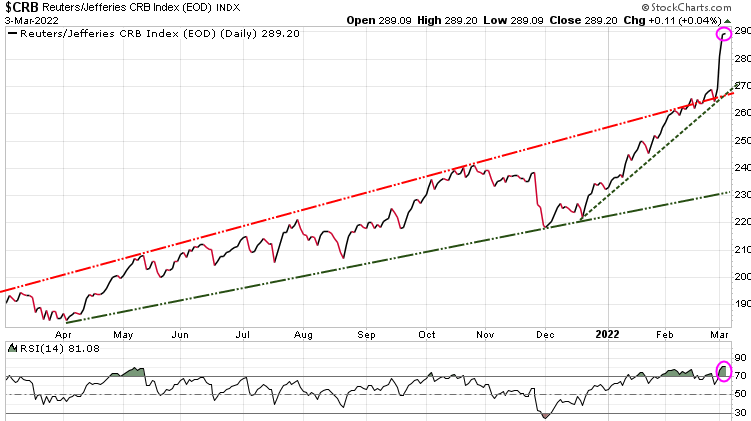
Commodities have been hot as reflected by this chart of the Reuters/Jeffries CRB index. Note at bottom of chart, based on RSI, commodities are technically overbought.
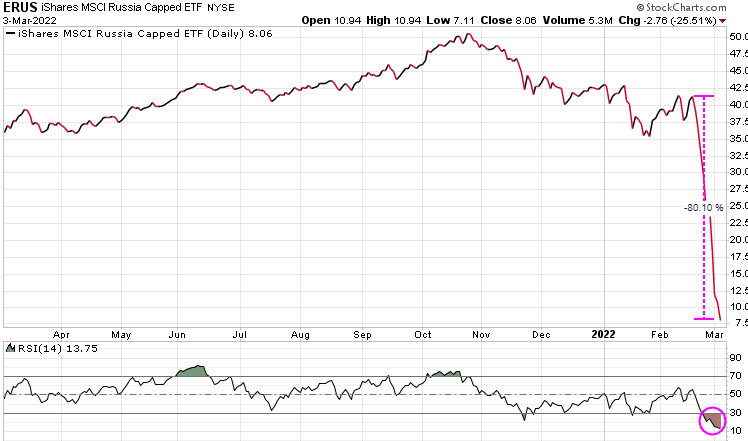
Russian stocks are being hit hard and the iShares Russian ETF was down another 25% today, and is now down over 80% since the invasion into Ukraine. Note at the bottom of the chart, this ETF is extremely oversold at this point. That doesn’t mean it can’t drop lower, but suggests we should see a bounce soon. If looking to make a speculative trade here, we suggest waiting until you see a move off the floor.
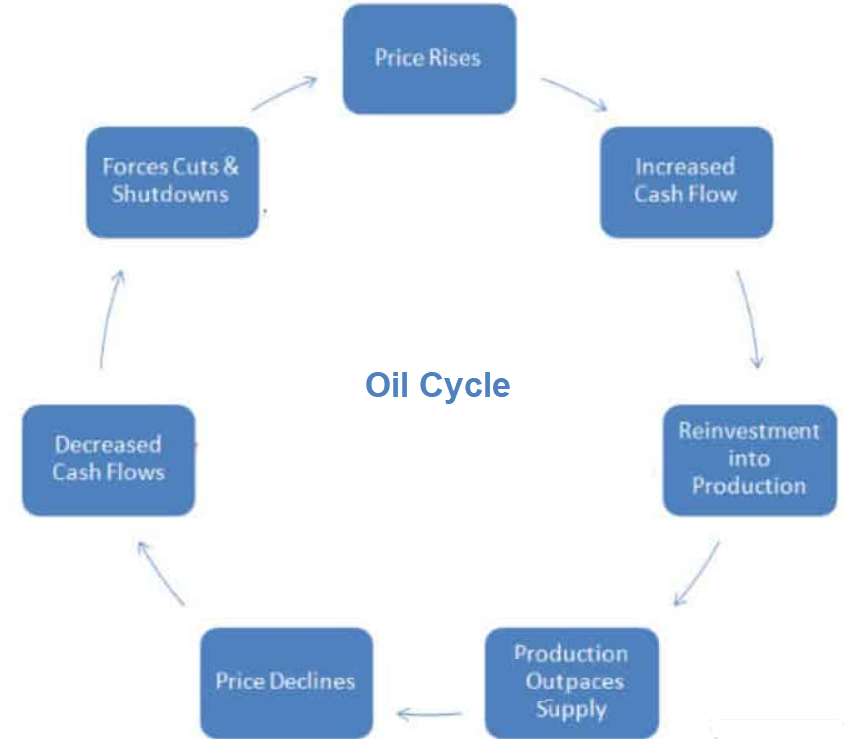
Crude oil prices briefly surged to their highest levels since 2008 Thursday morning before pulling back a bit. Still, at about $110 a barrel, there are growing concerns that skyrocketing energy prices could lead to a severe economic pullback in the US and around the globe. The following chart shows the oil cycle where the cure for high oil prices is high oil prices. As oil prices keep rising, it starts to act like a tax on consumers, ultimately affecting demand.
A worldwide recession would seriously hit demand for oil products.
Stay tuned!