Market Notes – May 19/23
After receiving positive updates from retailers that reinforced the absence of an impending recession, the stock market surpassed the trading range that had confined it since February. This breakthrough triggered significant short covering and a surge of investment in the technology sector index, once again spearheaded by the mega-cap companies, as we have highlighted all year.
Once again, Big Tech, and mainly the 8 Big Tech stocks have accounted for almost all of the gains for the year in the broad markets. The Nasdaq 100 has jumped to a new all-time high this week, and Microsoft and Apple now make up 14% of the S&P 500 market cap. Combined, they have added over $1 trillion in value so far in 2023.
If not for the AI frenzy, stock indices would be down for the year, So, it’s been a very distorted bullish rally.
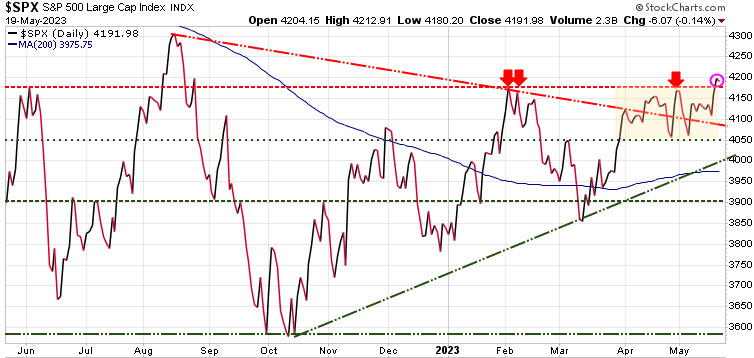
After three failed attempts (red arrows) since February, the S&P 500 broke above its key resistance level of 4175. If it can break and hold above 4200, then it could have a rally and test the August high at 4305. A break below 4050 would open the door for a more significant decline.
In speaking on This Week in Money, Martin was asked if the Fed starts cutting rates will it jump start the markets. While the masses believe that to be true. Martin highlighted that history says quite the opposite happens. Typically, when the Fed PAUSES after a series of rate hikes, there is a brief uptick in the markets. But what the red arrows on the chart below shows, it is when the Fed starts to CUT rates, that the big losses occur.
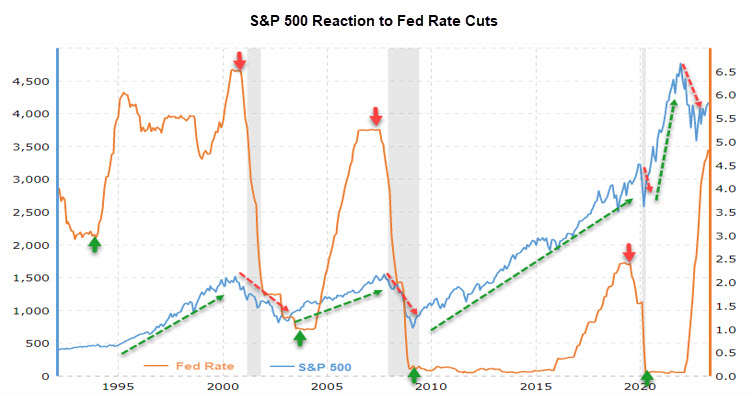
This makes sense, as the reason the Fed starts cutting rates is the economy is in trouble and likely headed for a recession, so investors dump stocks because stocks DO NOT do well in a recession. What the chart shows is the markets typically fall as rates are cut and not until the FED STOPS CUTTING (green arrows) do stocks start to rise again.
Currencies:
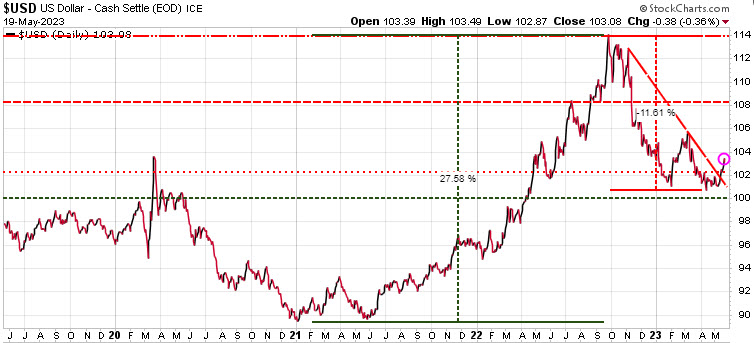
The $US was very strong from early 2021, when the Fed started aggressively raising rates till Sept 2022, and over that 22 month period the $US jumped over 27%.
Back in October, we called for a top in the $US and since then it has fallen almost 12%. But in the last 7 weeks, the $US has been forming a base formation and in the last 2 weeks has been rising, having now broken above that downtrend line from last fall (red diagonal line), and also breaking above the tight trading range it has been in since mid March.
Why is this happening? One thought we have is that for most of the past decade the mantra on Wall Street has been ‘Don’t Fight The Fed.’ But ever since the Fed started to raise interest rates, the markets HAVE been fighting the Fed, not believing they would continue to raise rates. For most of the past year, the Fed, Bank of Canada and the ECB have all stated that they will keep rates high until inflation is near 2%. Today, inflation in the US is 4.9%, in Canada it is 4.4%, and in most of Europe it is over 7%. That suggest these central banks DO NOT want to cut rates, but at some point they will likely have to, due to some serious hit to the economy.
For now, the $US is looking like it is getting its legs.
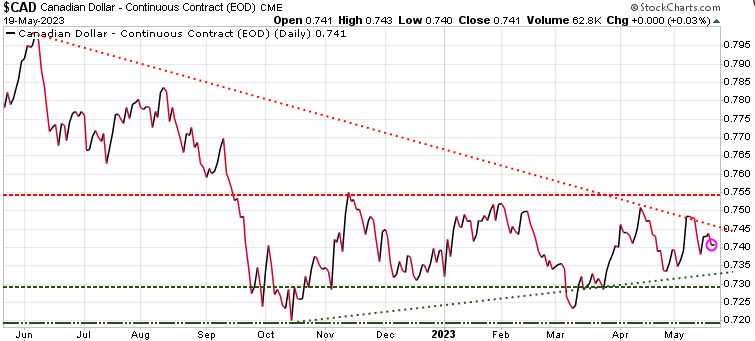
For the $CAD, just like most every other currency, it trades inverse to the $US. The $CAD has been trading in a tight range between 72.5 and 75.50. The $CAD is also forming a wedge pattern where it will soon break out either up or down.
Gold:
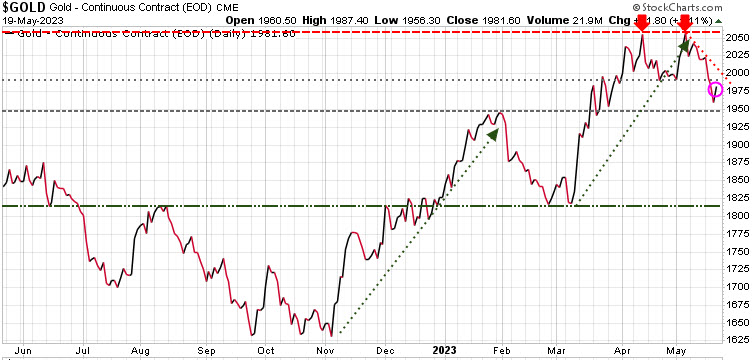
Gold and silver have had a terrific couple of runs recently; from November to late January, then another from early March to early May (green diagonal arrows).
Gold has twice tested key resistance at 2060 (red arrows) and even spiked intra-day to 2083 about a couple of weeks ago. But since then, we have seen gold and silver decline, with gold down ~$140 from that intra-day high of 2083. On Thursday, gold hit our target low at 1950 and has bounced Friday with debt ceiling talks breaking down.
Silver was down over 10% in a little over 2 weeks before Friday’s bounce. In BULL markets silver outperforms gold and in BEAR markets silver underperforms gold.
One thing that we have been watching is that the mining stocks have been lagging the metals – something we are keeping an eye on
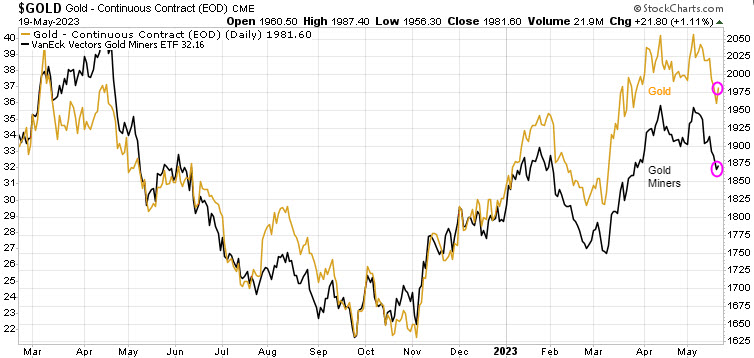
We are in a pullback here, which gold and silver needed, so that’s healthy. We think gold and silver will continue to outperform the S&P 500 for the next few years. One of the big drivers for gold will be the loss of confidence investors have in government. Once that confidence is broken, we expect gold to rise along with the $US as safe-haven plays.
Based on seasonality, gold and silver typically have a great run starting from July till September.
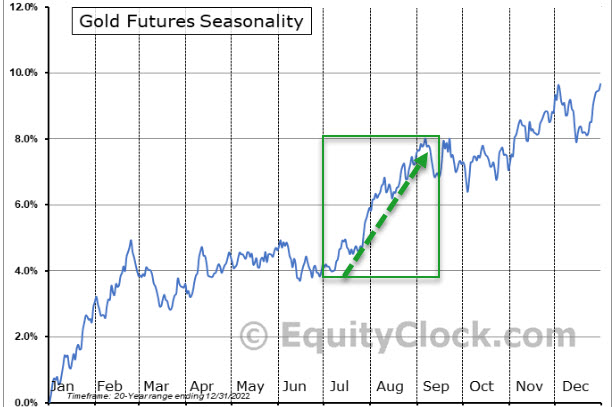
We suggest buying the dips.
Stay tuned!
Special Offers
Trend Letter:
Since start-up in 2002 Trend Letter has provided investors with a great track record, giving exceptionally accurate information about where the markets are going, and it has explained in clear, concise language the reasons why. Using unique and comprehensive tools, Trend Letter gives investors a true edge in understanding current market conditions and shows investors how to generate and retain wealth in today’s climate of extreme market volatility.
A weekly publication covering global bonds, currencies, equities, commodities, & precious metals. Publishes every Sunday evening, covers equites, currencies, precious metals, commodities, and bonds. Each weekly issue is about 50 pages, mostly charts, with key bullet points to make easy to understand. A 10-15 min read
Timer Digest says: “Trend Letter has been a Timer Digest top performer in our Bond and Gold categories, along with competitive performance for the intermediate-term Stock category.”
Technical Trader:
Trend Technical Trader (TTT) is a premier hedging service, designed to profit in both up and down markets.
TTT isn’t just a hedging service. Its timing strategies have returned fantastic gains on the long side. See examples here
Included is our proprietary Gold Technical Indicator (GTI).
Trend Disruptors:
Disruptive technology trends will propel our future and the reality is that no industry will go untouched by this digital transformation. At the root of this transformation is the blurring of boundaries between the physical and virtual worlds. As digital business integrates these worlds through emerging and strategic technologies, entirely new business models are created.
Trend Disruptors is a service for investors seeking to invest in advanced, often unproven technology stocks on the cheap, with the objective to sell them when masses finally catch on. Covering Artificial Intelligence (AI), Virtual Reality (VR), Augmented Reality (AR), 5G, Quantum Computing & many more.
All subscriptions in $US
Special Offers
| Service | Regular Price | Special Price | Saving | Subscribe |
|---|---|---|---|---|
| Trend Letter | $599.95 | $349.95 | $250 | Trend Letter $349.95 |
| Technical Trader | $649.95 | $349.95 | $300 | Trend Technical Trader $349.95 |
| Trend Disruptors | $599.95 | $349.95 | $250 | Trend Disruptors $349.95 |
| Better Deals | ||||
| Trend Letter + Technical Trader | $1,249.90 | $549.95 | $699.95 | Trend Letter & Technical Trader $549.95 |
| Trend Letter + Trend Disruptors | $1,199.90 | $549.95 | $649.95 | Trend Letter & Trend Disruptors $549.95 |
| Technical Trader + Trend Disruptors | $1,249.90 | $549.95 | $699.95 | Technical Trader & Trend Disruptors $549.95 |
| Best Deal | ||||
| Trend Suite: Trend Letter + Technical Trader + Trend Disruptors | $1,849.85 | $649.95 | $1,199.90 | Trend Suite: TL + TTT + TD $649.95 |
