The prospect of Donald Trump’s DOGE team (Elon Musk & Vivek Ramaswamy) tackling government inefficiency and wasteful spending has captured headlines. They promise bold reforms, aiming to shrink government and cut through entrenched bureaucracy. While such rhetoric is appealing, history suggests investors should view these claims with skepticism.
Historical Precedents of Failed Reform Efforts
- Golden Fleece Awards In the 1970s, Senator William Proxmire created the Golden Fleece Awards to spotlight wasteful government spending. These awards famously exposed egregious examples, such as a $3 million study on why people fall in love. However, beyond the headlines, the initiative failed to create structural changes in government spending habits. The exposed waste was often symptomatic of deeper inefficiencies that remained unaddressed.
- Reagan’s Grace Commission President Ronald Reagan’s administration established the Grace Commission in 1982 to eliminate waste and inefficiency in the federal government. The commission’s final report identified potential savings of $424 billion over three years. Despite the bold recommendations, most of its proposals were never implemented due to political resistance and the complexities of bureaucratic inertia. As a result, the federal government continued to grow, both in spending and scope.
- Clinton’s Reinventing Government Initiative In the 1990s, President Bill Clinton’s administration launched the National Partnership for Reinventing Government (NPR), spearheaded by Vice President Al Gore. The initiative promised a leaner, more efficient government, generating high-profile measures like consolidating agencies and cutting federal employees. For example, one proposal identified excessive costs associated with duplicative procurement processes between departments, but these inefficiencies were never fully addressed due to bureaucratic inertia and competing priorities. While NPR achieved some success in trimming low-hanging fruit, it did little to address systemic inefficiencies or reduce overall federal spending in the long term.
Challenges Facing the DOGE Team
The historical failure of these well-intentioned initiatives highlights the enormous challenges facing the DOGE team.
- Bureaucratic Resistance Bureaucracies are deeply entrenched, with layers of rules, regulations, and stakeholders resistant to change. Agencies often prioritize self-preservation, and efforts to reduce their size or influence are met with significant pushback.
- Political Realities Cutting waste and shrinking government is a politically charged endeavor. Every line item in the federal budget has a constituency that benefits from it. Politicians from both parties often rally to protect spending that benefits their districts or key donors.
- Complexity of Wasteful Spending Government inefficiency is not just about lavish spending or unnecessary projects. It’s often tied to structural issues such as outdated procurement processes, overlapping jurisdictions, and unfunded mandates. Addressing these requires systemic reforms that are time-consuming and politically unpopular.
- The Showmanship Factor Both Trump and Musk are known for their charisma and flair for the dramatic. While this generates attention and enthusiasm, it often overshadows the hard, unglamorous work required for real reform. Investors should be cautious about conflating high-profile announcements with tangible results.
The Dire Need for Reform
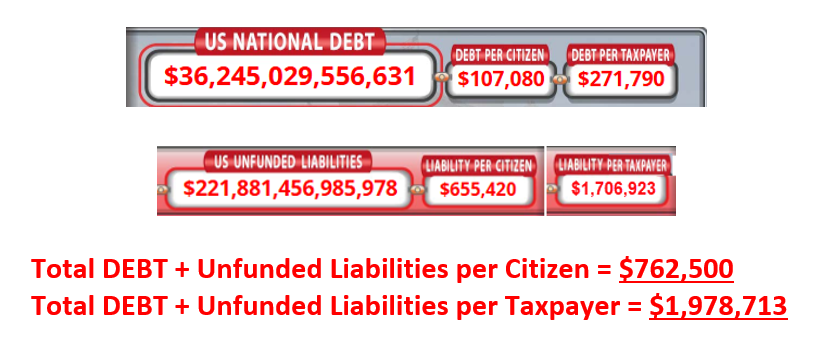
While skepticism about these reform promises is warranted, there’s no denying that government waste and inefficiency must be addressed. The United States’ fiscal situation is unsustainable, as highlighted by the US Debt Clock. As of December 19, 2024, the national debt exceeds $36 trillion. Then there are unfunded liabilities—such as Social Security and Medicare obligations, which total $221 trillion. Combined, this translates to an overwhelming burden of $762,000 per citizen and nearly $1,980,000 per taxpayer.
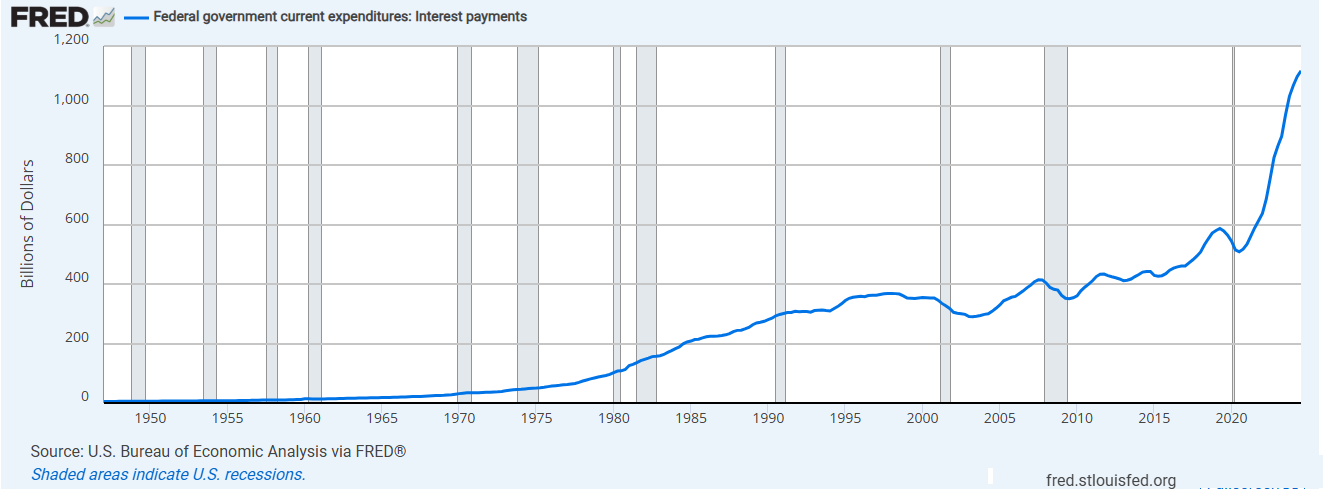
Furthermore, the US government is currently paying over $1.13 trillion annually in interest on its debt alone, a staggering figure that constrains fiscal flexibility and exacerbates long-term financial challenges.
Such figures underscore the desperate need for meaningful reform to ensure long-term fiscal stability.
Lessons for Investors
For investors intrigued by the potential economic benefits of government reform, a dose of realism is essential. History shows that promises to overhaul government often fall short, not for lack of effort but due to the scale of the task. While the DOGE team’s proposals may create temporary market optimism, long-term impacts depend on their ability to overcome the same entrenched challenges that have stymied past efforts.
In the end, skepticism isn’t cynicism; it’s a tool for navigating the unpredictable intersection of politics and markets. At the same time, the fiscal realities of unchecked government spending highlight that reform isn’t just desirable—it’s imperative. While we remain skeptical that the DOGE team can overcome these hurdles, we sincerely hope they can find a way to drive meaningful change and address the urgent challenges related to government wasteful spending.
If some success is achieved, Canada and most other Western countries need to pay attention, as similar inefficiencies plague their own systems.
Stay tuned!!