

Is the stock market about to hit a seasonal decline?
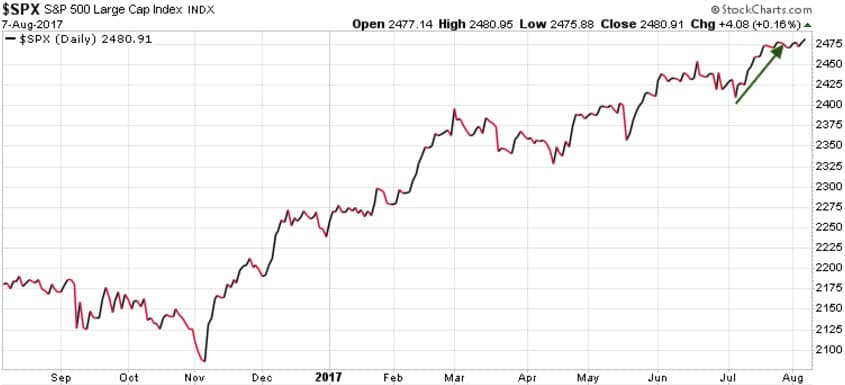
Generally, the well-known trading adage “Sell in May and go away” works, as long as you re-enter the market at the right time. This year however, the markets have been strong and are higher today than they were in May, driven primarily by the strong rally in July.
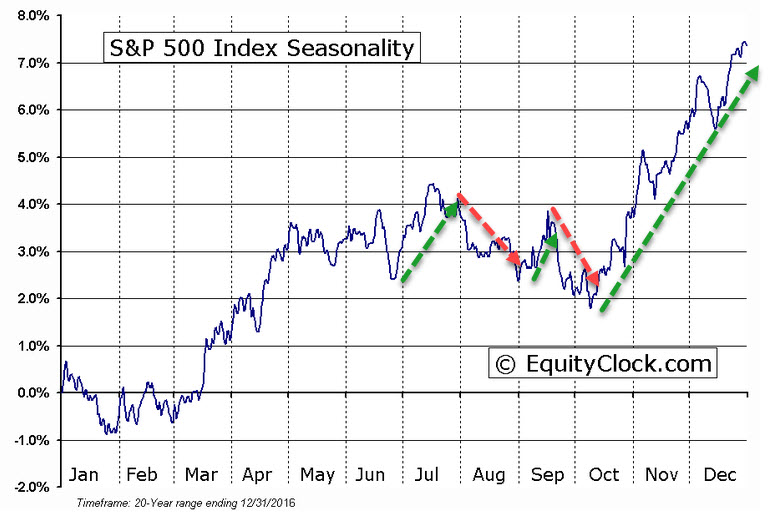
As we can see on the Seasonality Chart below, a July rally is the norm, not the exception. Based on data from the past 20 years, it is the month of August that typically sees a strong correction. September tends to follow with a rally to start the month, then sell-off into October. It is mid October where we generally see the market pick up again, with a year-end rally.
We are still long, but just entered an “insurance” trade in case we do get that seasonal correction heading into September.
Stay tuned!