
October 19/18
We follow the trends and capital flows. Remember, this is a global market, it is all connected.
Stocks
Today was the 31st anniversary of ‘Black Monday’, when in 1987 the Dow dropped a massive 23% in one day. Today we saw nothing like 31 years ago, with the S&P 500 up almost 30 points, before giving it all up and closing down a single point. With volatility ramping up, traders are being more reluctant to hang on to stocks over the weekend, fearful that some event (or tweet) could send the market on another sharp decline.
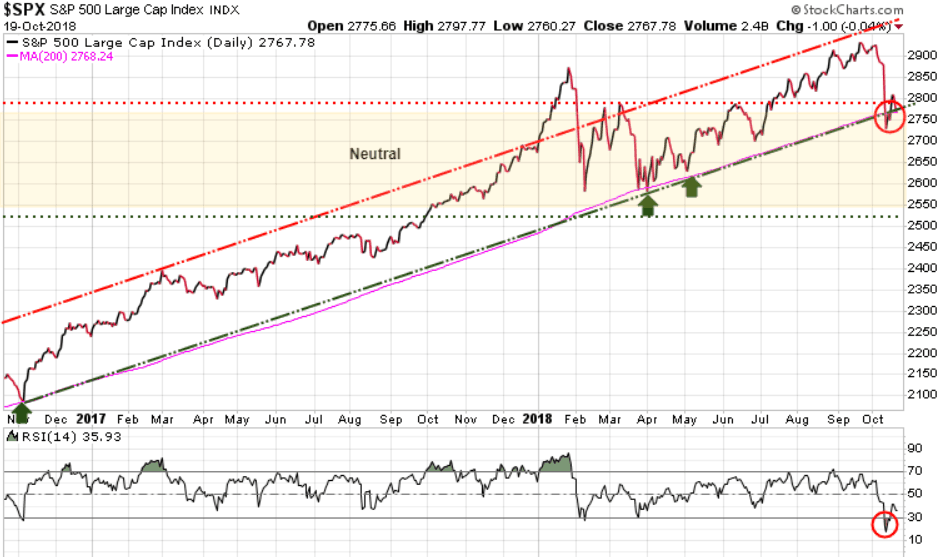
Last week after the large declines on Wednesday and Thursday we highlighted how the 200-day MA (pink line on chart) was a very key support area for the S&P 500. The last three times this support area was tested (November, March, and May) this support level held (green arrows on chart below).
Last week we also noted that the Relative Strength Index (RSI) had dropped to 17.66. An RSI reading above 70 indicates that the market is ‘overbought’ and that investors have become ‘complacent’, with a ‘risk-on’ sentiment. Conversely, an RSI reading below 30 indicates that the market is ‘oversold’, and that investors have become ‘fearful’, with a ‘risk-off’ sentiment. Whenever we get to these ‘overbought’ or ‘oversold’ extremes we typically see the market reverse and move in the opposite direction.
Looking at the lower part of the chart we see that the Relative Strength Index (RSI) is now back above 30, at 35.93.
Continue to watch the 200-day MA and if the S&P cannot climb back and close solidly above this support it means we are not out of the woods yet and that more moves to the downside are certainly possible. If it can hold above that level, then this could be the low for this move and we head higher to test the previous high at 2930.
Long-term trend is bullish
Immediate trend is neutral
Our current position is neutral
Gold
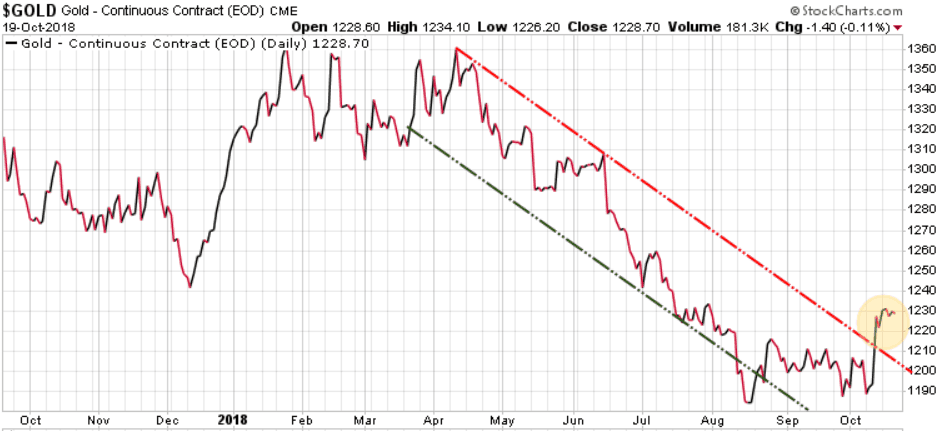
Gold was flat this week, having broken out of its near-term downtrend channel last week. Gold now needs to close above 1246, then push through and close above 1260, 1307, and 1377 to have a chance of having a solid bull run.
Long-term trend is bearish
Immediate trend is bullish
Our current position is a buy
There are talking heads flooding the airways with their opinions, but we just watch the numbers, and let the market tell us what direction it is going. The markets can be very deceptive and will play on your emotions. Instead of forming an opinion of what you think the market should do, watch the key support and resistance levels, and see what the market is actually doing.
The reason that we see the market reverse when it hits extremes is because the majority must always be wrong to fuel bull and bear markets. In the last stages of a bull market a mania is created where everyone wants in. Prices rise dramatically creating a FOMO (fear of missing out) sentiment where the average investor feels incredible pressure to jump into the market, right at the extreme top. At that point the early investors are more than happy to sell to the masses. These late to the party investors are then stuck holding stocks when there are no more buyers.
In bear markets we see a similar story. As prices start to fall a new panic is created where everyone wants to sell, but there are no buyers, so the decline in prices escalates as everyone is running to the exit. Typically those same late to the party investors who bought right at the top, are the last to get out, often finally selling right near the bottom. And then the cycle repeats.
This weekend’s issue of The Trend Letter will have full coverage of where we sit with all markets, including the equity, bond, currency, precious metals, and commodity markets. If you are not a subscriber but would like to be, we are offering a special discount of $200 off the regular price of $599.95, so you only pay $399.95. To take advantage of this offer, click here.
If you have a substantial portion of your portfolio in stocks, or just need to protect yourself in case of a severe correction, seriously consider a ‘hedging’ strategy. While we expect to see higher highs before the ultimate top in this bull market, we certainly expect to see a great deal of volatility along the way. Last week was a wake up call for those who are not prepared for a significant correction.
We do not know of a better hedging service than Trend Technical Trader (TTT) which is designed to make money in a down market. TTT uses a combination of conservative and aggressive strategies to position subscribers to profit in a declining market. These TTT trades are simple to action, the same as any trade recommended in Trend Letter. We are offering a subscription to TTT for only $399.95 (regular price is $649.95). Click Here to take advantage of this offer. It’s your money – take control.
Stay tuned!