
S&P hits our target today, but is this the bottom?
For months we have highlighted our model’s target of 2470 as a low for the S&P 500. In our November 11th post we showed our model’s bearish projection for the S&P 500 to have a cycle inversion targeting a drop to 2600 and even 2500 by year-end. In our November 20th post we showed the following chart of our models’ projected path for the S&P going into year-end.
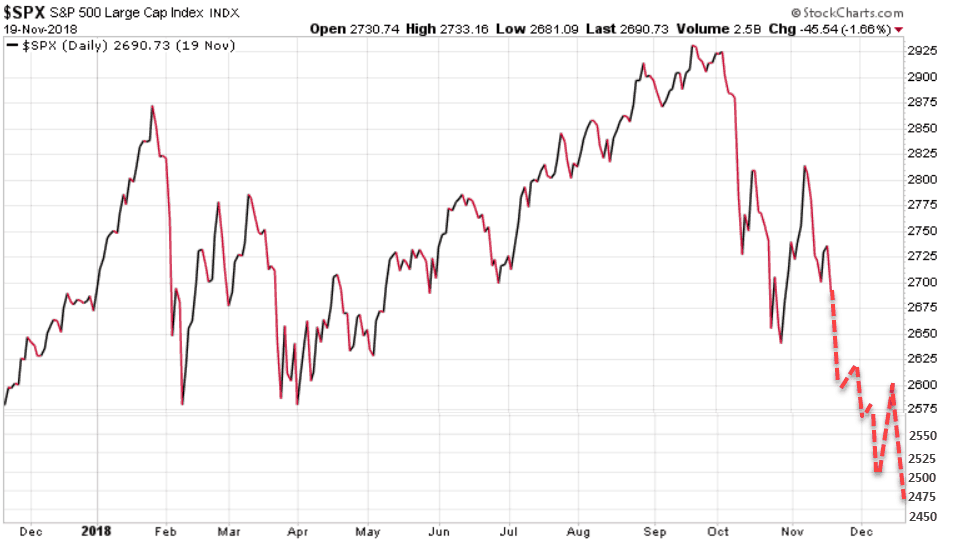
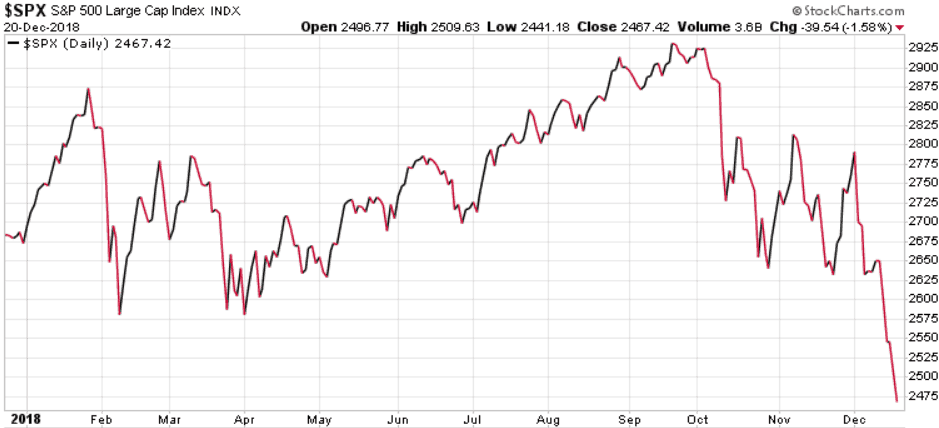
As we can see on the chart below the S&P is trading almost exactly as our model projected, closing today at 2467, just 3 points off our target. After the initial test of 2500, our models called for a rally back to 2600, then another re-test down to 2470. Understand that if the S&P breaks below that 2470 support area we could be in for a much deeper correction. Watch Friday’s close, we will update subscribers in Sunday’s issue of the Trend Letter.
The fundamentals that are currently driving this correction are:
- The Fed’s decision yesterday to raise rates another .25%, plus targeting two more increases next year
- Ongoing concerns about trade, especially with China
- Brexit
- Ongoing concerns about Italy and the EU
- and now the threat of a US government shutdown
With trade, here is what we told our Trend Disruptors Premium subscribers this morning…
“We know that Donald Trump watches the markets closely as he feels it is virtually an arbiter of his success or failure as a President. We know that ‘The Donald’ will want a rising stock market as he enters his re-election campaign and he knows he will not get one until he gets some kind of deal with China. We believe that Chinese President Xi also needs a deal, so we expect that common interest will lead to an agreement.”
Bottom line is that technically speaking the S&P has followed our model’s projection to a tee and now we need to see if this 2470 range is indeed the bottom. As noted in prior issues, our model projected that after hitting 2470 we should see a rally back to 2600 and then likely another test of the 2500 level.
Are you worried?
If you are worried about your investments and are losing sleep at night because of this market collapse, seriously think about subscribing to our hedging service Trend Technical Trader (TTT). TTT currently has two open positions that are directly hedging against a stock market decline. Those positions are up 63% (since Oct 4/18) and 38% (since Sept 5/18). In addition to these two open positions, TTT has recently closed two hedge positions for profits of 49% (in 2 weeks), and 54% (in 6 weeks).
The message here is simple, you do not need to lose money in a declining market, you can not only protect your investments and your wealth, but you can actually make significant gains in a relatively short period of time using these hedging strategies. Think of using these hedging strategies as you would think of buying fire insurance for your family home. Understand that these hedging strategies are simple for any investor to action, a simple click of the mouse on your online trading account, the same as trading any other stock or ETF.
If you would like to subscribe to TTT and have a plan to not just protect yourself during the next market correction or crash, but to actually profit from it, CLICK HERE and receive $250 off the regular price and pay only $399.95. It’s your money – take control!
Also…
We will make the same offer for those who are not yet subscribers to the Trend Letter. CLICK HERE to subscribe to the Trend Letter for only $399.95, a savings of $200.
Best Deal…
Subscribe to both the Trend Letter & Trend Technical Trader for only $699.95, a savings of $550.00. CLICK HERE to take advantage of this offer.
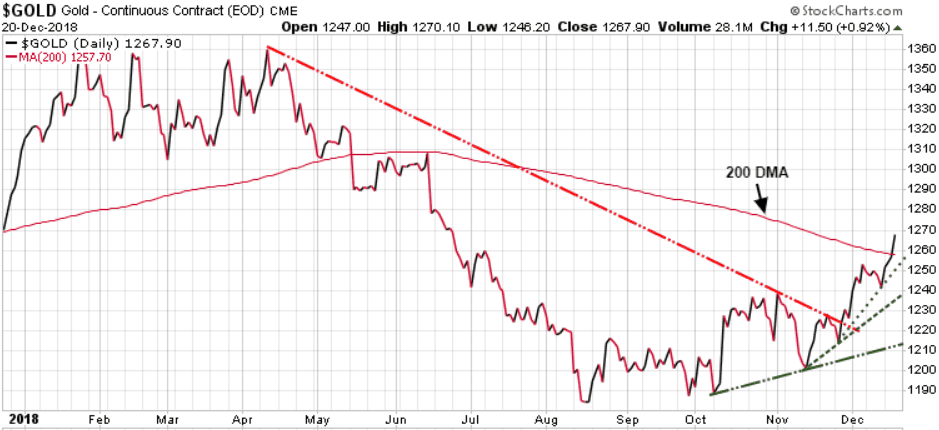
Gold
Gold is finally breaking out and has now pushed through near-term resistance at 1262 and more importantly through its 200-DMA.
Gold bottomed in mid-August, and has since slowly been moving higher, and has been increasing that pace since mid-November. Next target is the strong resistance in the 1280-1300 area. Looking good so far!
Stay tuned!
