What is this megaphone pattern telling us?
A megaphone pattern is a visual representation of a recurring price pattern commonly observed in the stock market. Similar to other chart patterns, the emergence of the megaphone pattern tends to coincide with specific market conditions. Megaphone patterns show the potential for both higher highs and lower lows.
In the Trend Letter issued last Sunday we published the latest update to our TL Forecaster Model’s weekly chart of the S&P 500. As we can see the TL Model has been extremely accurate projecting the movement of the stock market.
Note that we will be publishing the updated TL Forecaster Model projection to Trend Letter subscribers after month and quarter end.

As we approach the key 3000 resistance level we want to remind investors of how in our the April 28th issue of Trend Letter we alerted subscribers to the ‘megaphone’ or ‘broadening’ pattern that was forming with the S&P 500. Megaphone patterns show the potential for both higher highs and lower lows. Here is an updated version of that chart…
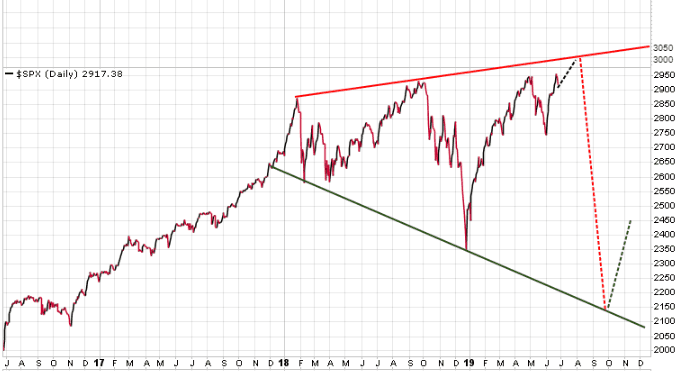
What we need to watch for here is the potential for a near-term top at new highs around 3000-3040 for the S&P 500 very near term. A break down from that level could result in a significant correction testing the lower level of the megaphone pattern. If we see a break above the upper level of the megaphone pattern near 3040 then this rally should continue higher.
Stay tuned!
