Market update – September 23/20
Equities:
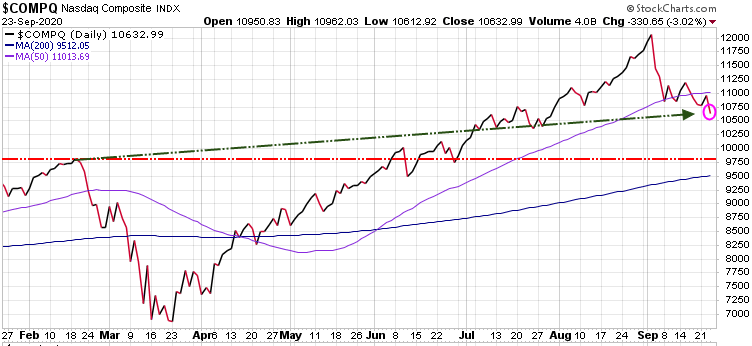
Nasdaq – down 330.65 points or 3.02%
The Nasdaq Index represents the tech sector and includes the world’s foremost technology and biotech giants such as Apple, Google, Microsoft, Oracle, Amazon, and Intel. No surprise to subscribers, this index has blown the doors off all other indexes as these stocks have been the market leaders all the way up. But now that we are seeing the markets turn, it is these same high powered stocks that are being hit the hardest. The Nasdaq has now dropped below its 50-Day Moving Average (purple line on chart). Note: In early September entered a short position on the Nasdaq with an easy to trade Exchange Traded Fund (ETF)
Russell 2000 – down 2.98%
The Russell 2000 represents American small cap stocks and the broader stock market and economy. We note that the small cap stocks did not come close to exceeding its February all-time high and has been struggling since early August to make any gains. Note that the Russell 2000 has dropped below its 50-DMA (purple line) and is now right on its 200-DMA (blue line), and a break and close below that level suggests a deeper correction.

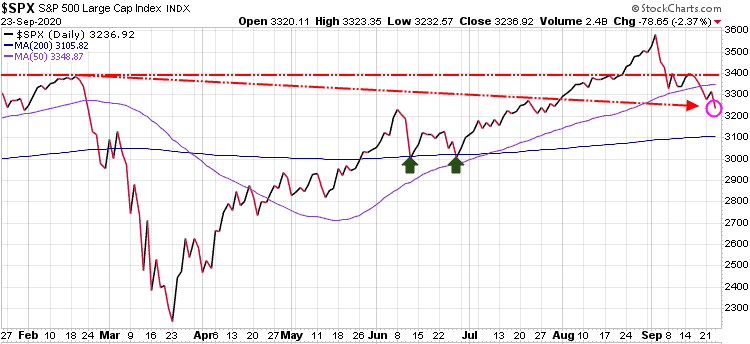
S&P 500 – down 78.55 point or 2.37%
The S&P 500 represents more retail domestic investors, which drove up the S&P 500 to new highs in early September, but is now back below its February high. The S&P 500 is also now below its 50-DMA. Note: In early September entered a short position on the S&P 500 with an easy to trade Exchange Traded Fund (ETF)
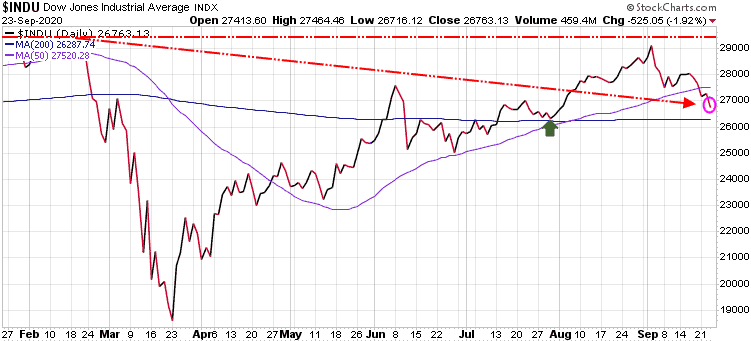
Dow Industrials – down 525.05 point or 1.92%
The Dow Jones Industrials reflects big institutional and international capital, and it did not make a new high after the March crash. Given that it did not rally as strong as the other indexes we expect it will not decline as deeply as the Nasdaq, Russell 2000 or S&P 500. The Dow has now dropped below its 50-DMA and is approaching key support at the 200-DMA which is 26,287.
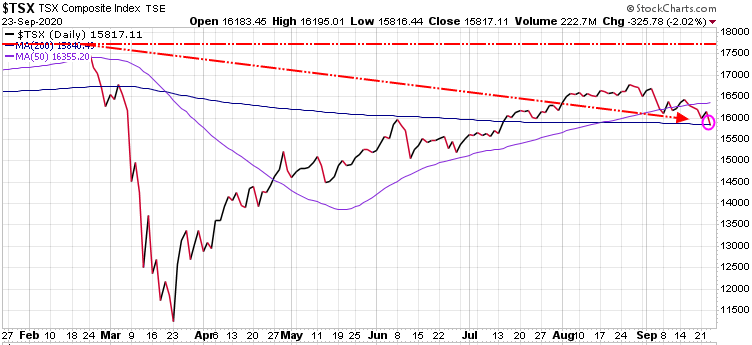
Canadian TSX – down 325.78 or 2.02%
The TSX represents most of Canada’s largest companies including many in the mining and banking sectors. The TSX was also not able not make a new high since the February high. The TSX has also dropped below its 50-DMA and is now testing support its 200-DMA (blue line).
Precious Metals:
Gold – down 39.20 or 2.05%
Gold closed today at 1868, just slightly above the August 12/20 intra-day low at 1865. If we see gold break below and close below 1865 we could see a re-test of 1800.

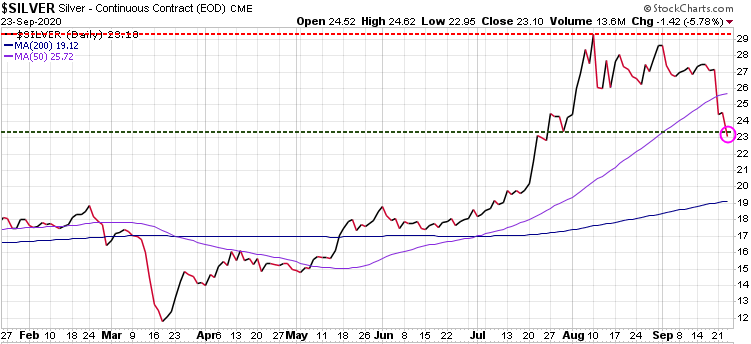
Silver – down 1.42 or 5.78%
Silver is the more volatile of the precious metals, generally moving higher than gold in bull markets, but also moving lower than gold in bear markets or market corrections. That is what is happening right now; while gold declined 2.05% today, silver dropped over double that rate at 5.78%.
Currencies:
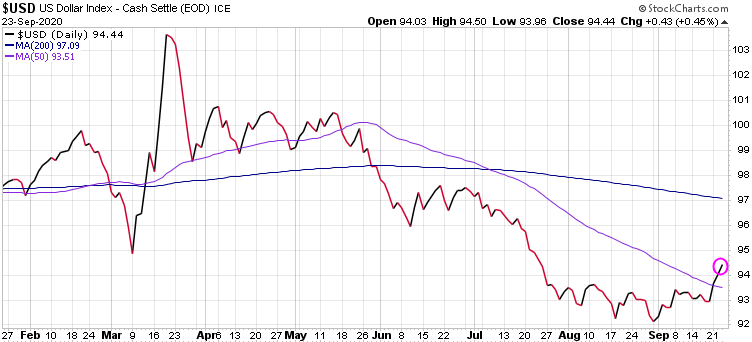
US dollar – up .43 or .45%
Despite all the doom and gloom projections for the $US, when investors get nervous and want some safety for their capital, the $US is still the ‘safe-haven’ currency.
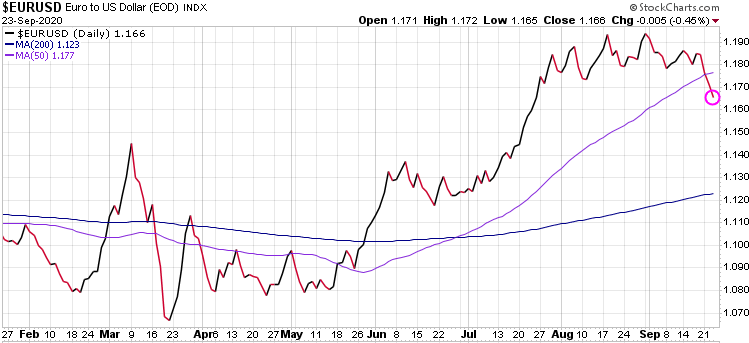
Euro – down .005 or .45%
Note: In late August we entered a short position on the Euro with an easy to trade Exchange Traded Fund (ETF)
Canadian dollar -.005 or .61%

If you are not a subscriber but would like to be, we are offering some great discounted rates for our three services.
Trend Letter:
Since start-up in 2002 Trend Letter has provided investors with a great track record, giving exceptionally accurate information about where the markets are going, and it has explained in clear, concise language the reasons why. Using unique and comprehensive tools, Trend Letter gives investors a true edge in understanding current market conditions, and shows investors how to generate and retain wealth in today’s climate of extreme market volatility.
A weekly publication covering global bonds, currencies, equities, commodities, & precious metals.
Timer Digest says: “Trend Letter has been a Timer Digest top performer in our Bond and Gold categories, along with competitive performance for the intermediate-term Stock category.”
Technical Trader:
Originally developed to be a premier hedging service designed to profit in declining markets, Trend Technical Trader (TTT) was evolved into an excellent all round trading service that prospers in both up and down markets. After delivering excellent gains during the March melt-down, TTT steered subscribers into gold trades and a number of long equity positions for phenomenal gains in very short holding periods.
TTT is an online service, updated every Monday, Wednesday and Friday, after the market close.
Trend Disruptors:
Disruptive technology trends will propel our future and the reality is that no industry will go untouched by this digital transformation. At the root of this transformation is the blurring of boundaries between the physical and virtual worlds. As digital business integrates these worlds through emerging and strategic technologies, entirely new business models are created.
Trend Disruptors is a service for investors seeking to invest in advanced, often unproven technology stocks on the cheap, with the objective to sell them when masses finally catch on. Covering Artificial Intelligence (AI), Virtual Reality (VR), Augmented Reality (AR), 5G, Quantum Computing & many more.
Special Offers
| Service | Regular Price | Special Price | Saving | Subscribe |
|---|---|---|---|---|
| Trend Letter | $599.95 | 299.95 | $300 | Trend Letter $299.95 |
| Technical Trader | $649.95 | $324.95 | $325 | Trend Technical Trader $324.95 |
| Trend Disruptors | $599.95 | $299.95 | $300 | Trend Disruptors $299.95 |
| Better Deals | ||||
| Trend Letter + Technical Trader | $1,249.90 | $524.95 | $724.95 | Trend Letter + Technical Trader $524.95 |
| Trend Letter + Trend Disruptors | $1,199.90 | $503.95 | $695.95 | Trend Letter + Technical Trader $503.95 |
| Technical Trader + Trend Disruptors | $1,249.90 | $524.955 | $724.95 | Trend Disruptors + Technical Trader $524.95 |
| Best Deal | ||||
| Trend Suite: Trend Letter + Technical Trader + Trend Disruptors | $1,849.85 | $610.45 | $1,239.40 | Trend Suite TL =TTT + TD $610.45 |
