Market Update
S&P 500
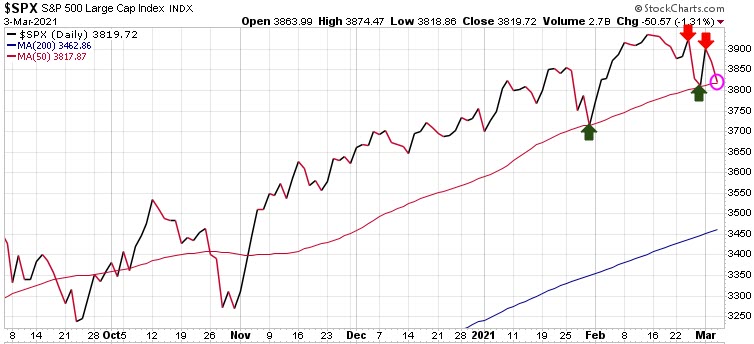
The S&P 500 was down 50.57 points or 1.31% today and is now testing near-term support at 3819, which is the 50-DMA (red wavy line on chart). The last two times the 50-DMA has been a strong support level, so if this level does not hold here it would be a bearish signal. What is troubling here is that we are seeing a pattern developing of lower highs and lower lows. A close below 3817 opens the door for the next support level at 3714, with key support being at the 200-DMA at 3462. Key resistance is at 4010.
Nasdaq
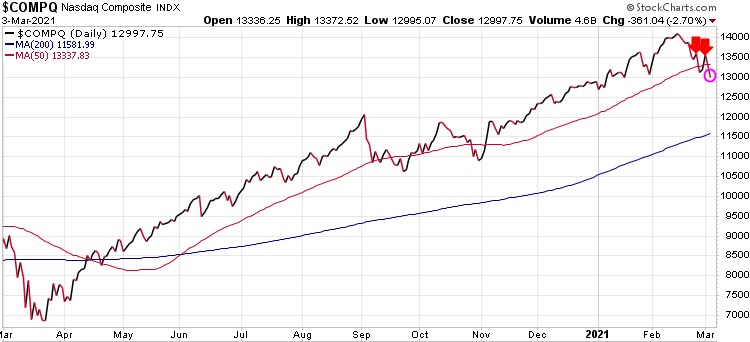
The Nasdaq was the biggest loser today, down 361 points, or 2.70%. The tech sector just experienced its worst two days since September. As we can see on the chart, the Nasdaq is also seeing lower highs and lower lows, and it has broken below its 50-DMA. This is bearish action.
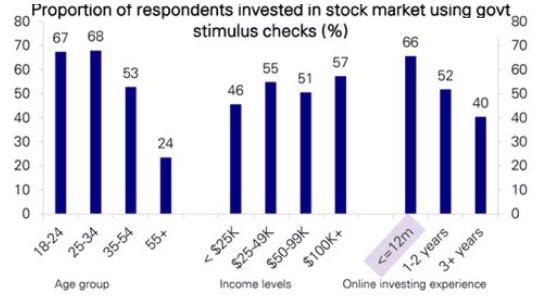
According to a Deutsche Bank survey, younger individuals were more likely to use their recent fiscal relief payments to invest in stock market. while income levels varied, majority have less than 12 months of online investing experience.
Canadian Equities
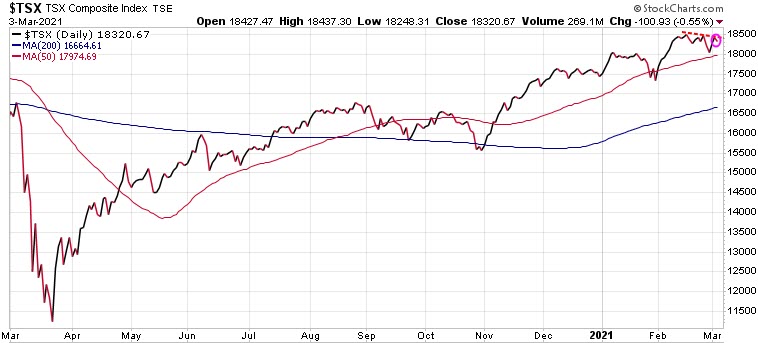
The Canadian market also declined today, down 100.93 pints of .55%. The Canadian market is also seeing lower highs and lower lows and will need to see its 50-DMA hold or we could see a more significant sell-off in this market.
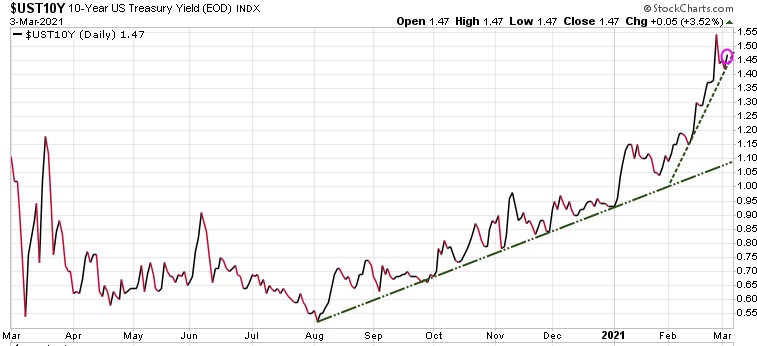
Bonds
Bonds resumed their sell-off, meaning yields were rising again, a key reason equities are selling off.
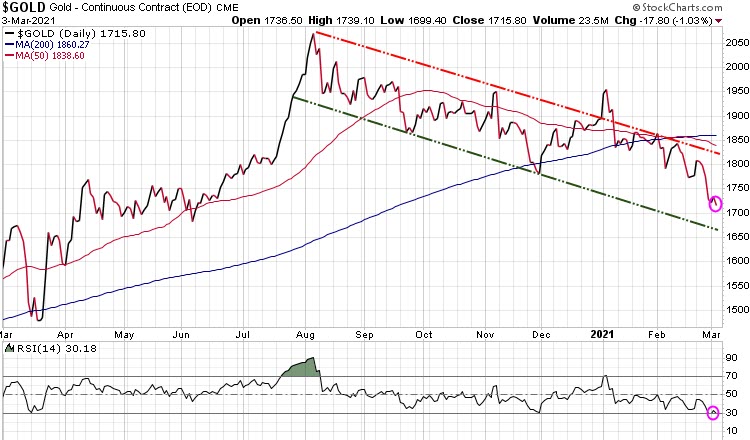
Gold
Gold was down 17.80 and remains stuck in its downtrend channel, unable to gain any momentum. Gold prices are falling as yields keep rising and the gold ETF capital exodus continues. Gold ETFs holdings had the 13th straight day of declines, the longest losing streak since December 2016. Based on RSI (bottom of the chart) gold is getting close to being technically oversold so a bounce should occur soon.
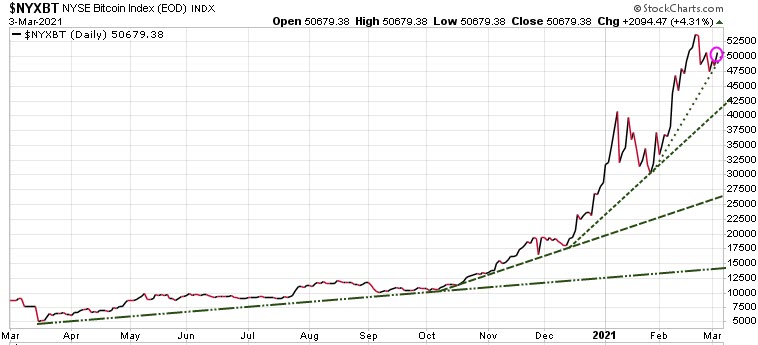
Bitcoin
Bitcoin continues to be volatile and seems to be the millennials’ preferred inflation hedge over gold. Bitcoin once pushed above through the $50,000 level.
US dollar
The US dollar continues to consolidate and attempt to gain some momentum to break through resistance at 91.50.
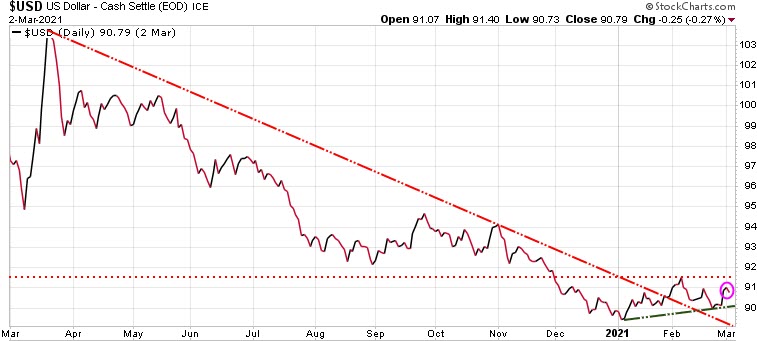
If we do see the equity markets decline here, capital will flow to the US dollar and US bonds as temporary safe-havens.
Are you prepared for this coming debt crisis? If not, seriously consider subscribing to Trend Letter & Trend Technical Trader for easy to follow strategies to not just protect your wealth during this coming crisis, but to actually increase your wealth. Click the button below to subscribe to both services and save $600 off the regular prices.
Stay tuned!