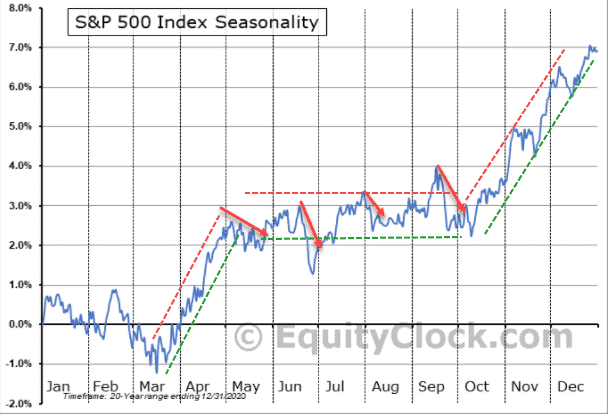
Sell in May ?
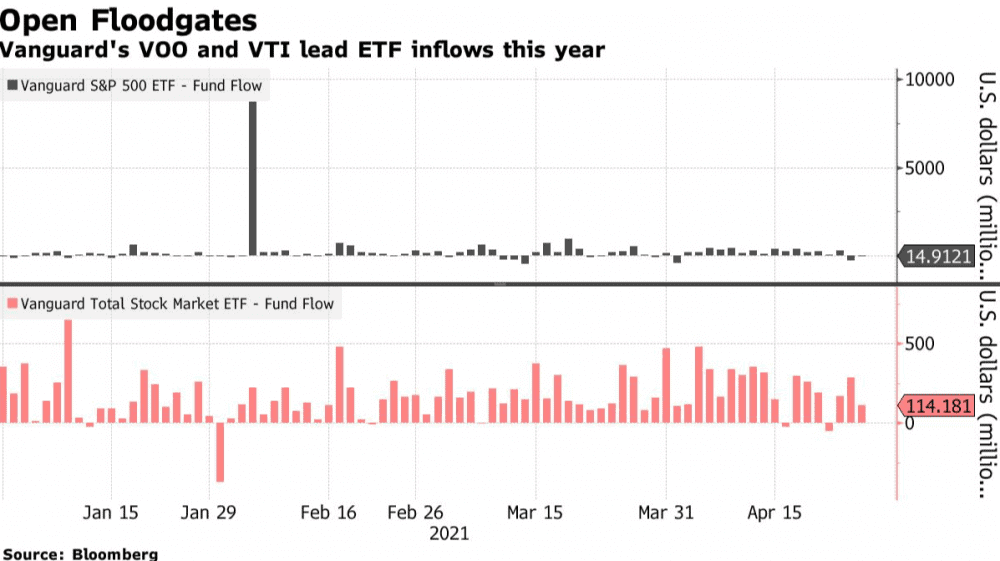
A $246 billion boom means stock ETF inflows already beat 2020. Record haul in Q1 helps surpass 2020’s $231 billion.
When this market finally tops, and it could be soon, all investors need to be aware of the massive amount of leverage in the markets right now. Investors had borrowed $814 billion against their portfolios as of late February, according to data from the Financial Industry Regulatory Authority (“FINRA”).
Investors obtain margin debt from their brokerages to buy stocks and other securities. The investor puts up the securities he owns as collateral for the loan. During a bull market, margin debt tends to rise, as the value of securities goes up, investors can borrow more money to buy even more securities.
It all works fine, as long as the markets keep rising. But today, margin debt levels are well above just a normal increase. Take a look at the extreme rise in the past year.
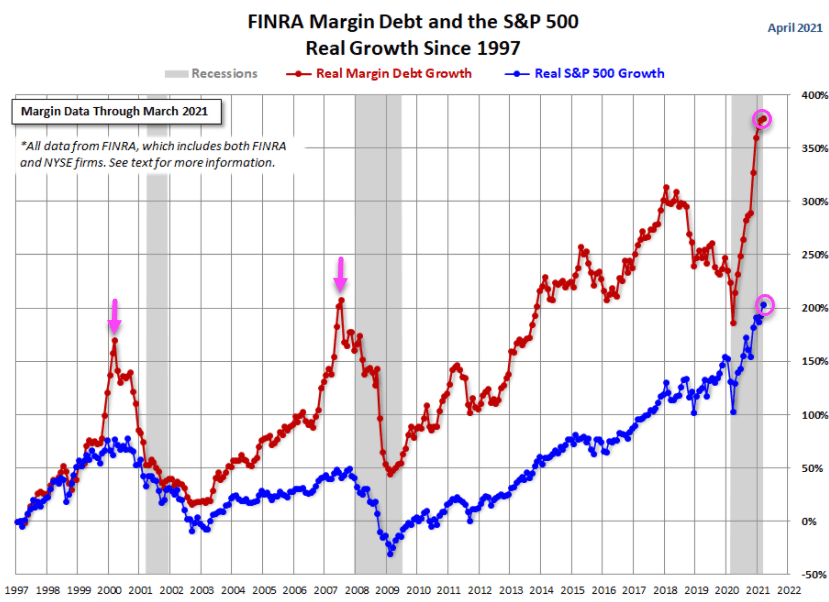
When we see this level of borrowing, we need to be cautious. We saw a similar pattern at the end of the 2000 tech bubble crash, and in 2007 just before the financial crisis.
After a major bull market, like the one we are in, ends, the subsequent decline can be very sharp and nasty. The resulting value loss in securities usually triggers ‘margin calls.’ For those investors who borrowed all this money from their brokerages, the value of their accounts drops with the stock prices, so they then need to add more cash to their accounts. If they don’t have enough money to meet the margin calls, their brokerages can liquidate other positions in their accounts to recapture the loans.
So far, stocks have been rocking higher, so this extra leverage is paying off. But when the markets top out, it could lead to a powerful decline or crash, as all that margin needs to be paid back.
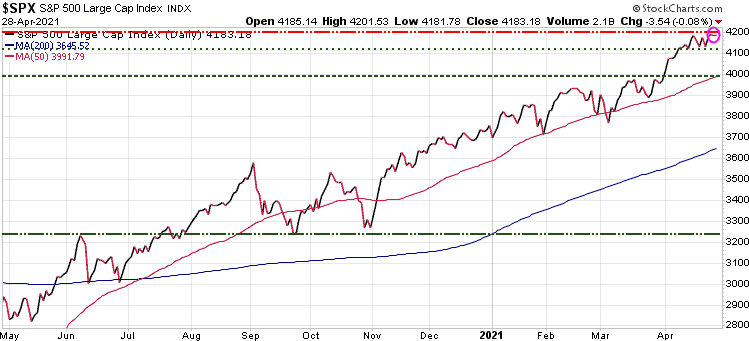
Looking at the market today, we can see that the S&P 500 has been trading in a tight range for the last two weeks. Our model had forecast a temporary high next week at 4200, so today’s close of 4183 leaves us in that ballpark. Now this top could simply be a period of consolidation where it trades sideways for a while. Or it could be a pull back or a more severe correction.
We do not believe at this time that this is the top for this 12-year bull market, but it could be a turning point, where we see a significant pull back or correction. Understand that this massive bull market WILL end, they all do. Be sure you have a plan in place to protect your wealth in the event of a serious market correction. If you need assistance, our Trend Technical Trader service was originally designed as a hedging service, to actually make money on market declines.
We are offering some great discounts to all of our services. Check the offers below:
Trend Letter:
Since start-up in 2002 Trend Letter has provided investors with a great track record, giving exceptionally accurate information about where the markets are going, and it has explained in clear, concise language the reasons why. Using unique and comprehensive tools, Trend Letter gives investors a true edge in understanding current market conditions and shows investors how to generate and retain wealth in today’s climate of extreme market volatility.
A weekly publication covering global bonds, currencies, equities, commodities, & precious metals. Over the 20 years Trend Letter has been published, it has achieved an incredible average return of 65% on its closed trades.
Timer Digest says: “Trend Letter has been a Timer Digest top performer in our Bond and Gold categories, along with competitive performance for the intermediate-term Stock category.”
Technical Trader:
Trend Technical Trader (TTT) is a premier trading service, designed to profit in both up and down markets. Included is our proprietary Gold Technical Indicator (GTI).
TTT had another excellent year in 2020 averaging +27.3% per closed trade with an average holding time of 9.5 weeks, or +149% annualized overall.
Over the past 5 years TTT’s closed trades have averaged +40% annualized.
Trend Disruptors:
Disruptive technology trends will propel our future and the reality is that no industry will go untouched by this digital transformation. At the root of this transformation is the blurring of boundaries between the physical and virtual worlds. As digital business integrates these worlds through emerging and strategic technologies, entirely new business models are created.
Trend Disruptors is a service for investors seeking to invest in advanced, often unproven technology stocks on the cheap, with the objective to sell them when masses finally catch on. Covering Artificial Intelligence (AI), Virtual Reality (VR), Augmented Reality (AR), 5G, Quantum Computing & many more.
Trend Disruptors has realized average annualized gains of 178% over its 3 years of service.
Money Talks - Special Offers
| Service | Regular Price | Special Price | Saving | Subscribe |
|---|---|---|---|---|
| Trend Letter | $599.95 | $399.95 | $200 | |
| Technical Trader | $649.95 | $399.95 | $250 | |
| Trend Disruptors | $599.95 | $399.95 | $200 | |
| Better Deals | ||||
| Trend Letter + Technical Trader | $1249.90 | $699.95 | $549.95 | |
| Trend Letter + Trend Disruptors | $1199.90 | $699.95 | $499.95 | |
| Technical Trader + Trend Disruptors | $1249.90 | $699.95 | $549.95 | |
| Best Deal | ||||
| Trend Suite: Trend Letter + Technical Trader + Trend Disruptors | $1849.85 | $799.95 | $949.90 |