Today’s Charts – September 20/21
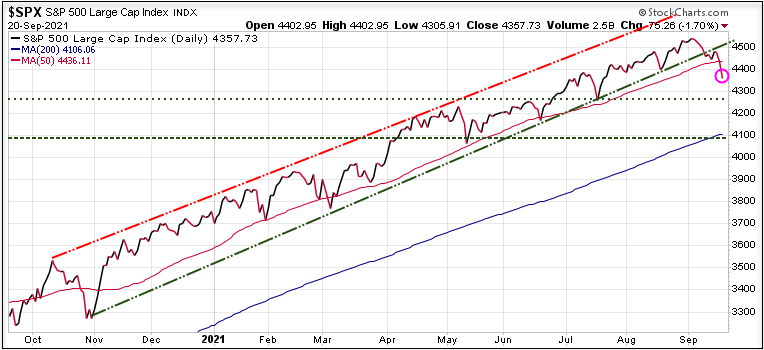
Stocks slid Monday, with major indices tumbling by over 2% during the worst points of the afternoon session and the S&P 500 down 123 points at one point. Investors nervously eyed the potential ripple effects of the default of a major Chinese real estate company, as well as ongoing debates over the debt limit in Washington.
Additionally, investors grappled with the continuing COVID crisis, and the calendar. As we have been warning subscribers, late September has proven to be the poorest time of the year for stocks every year for the past 20 years. And if all that wasn’t enough, there is the Fed meeting Wednesday and Thursday, with the worry that the Fed will look to begin to taper their $120 billion monthly bond purchase program to try to start dealing with the rapidly rising inflation.
The markets did rally off those lows in the last hour, with the S&P closing the day at 4357.73, down 75.26 or 1.70%. Note the S&P 500 has now fallen below its 50-DMA (red wavy line).
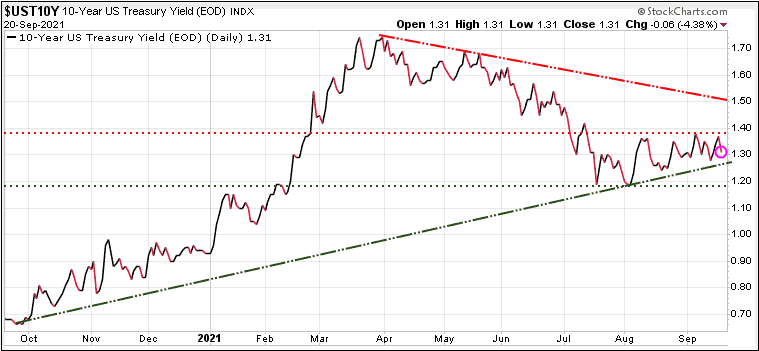
Bonds were up today as a safe-haven play, so given that yields move inverse to the bond action, yields were lower.
Gold had a little bump, up 12.40.
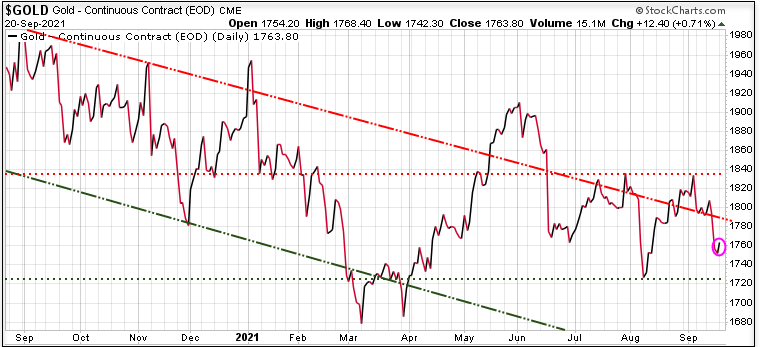
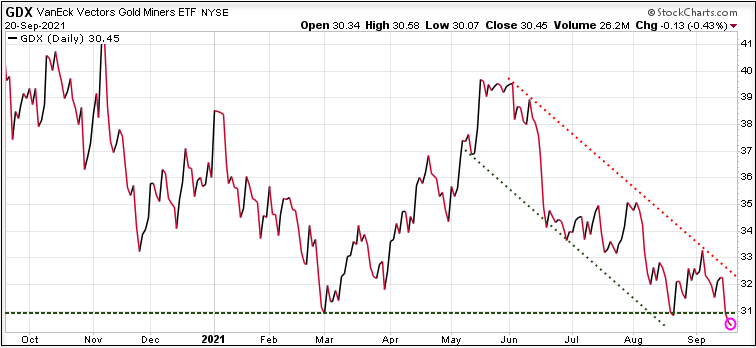
While gold had a small bounce, gold stocks continued their decline, having just dropped below near-term support.
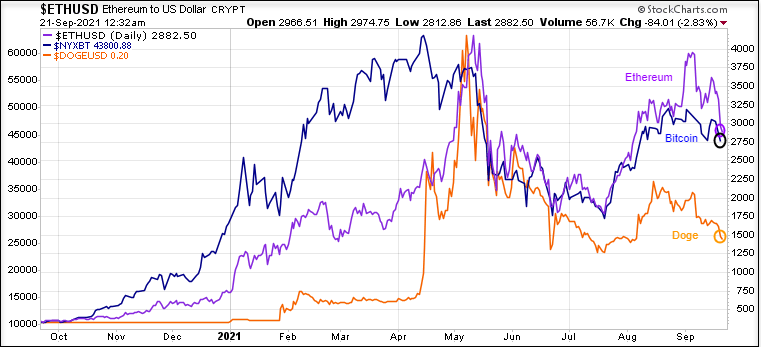
Cryptocurrencies continue to be very volatile, not being a safe-haven play today.
Stay tuned!