
Market update – September 28/21
Concerns over rising Treasury yields and sparring among Washington lawmakers over the debt ceiling and government funding weighed heavily on equities.
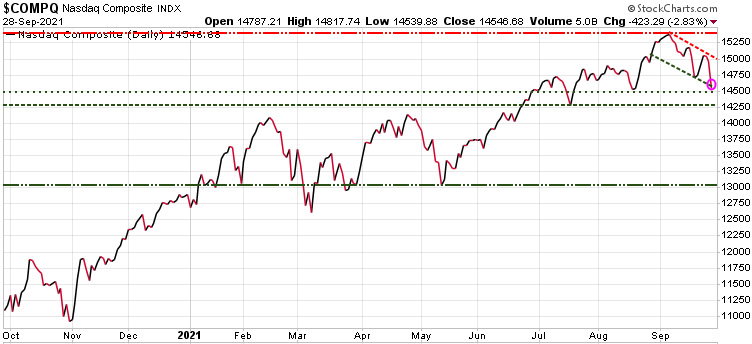
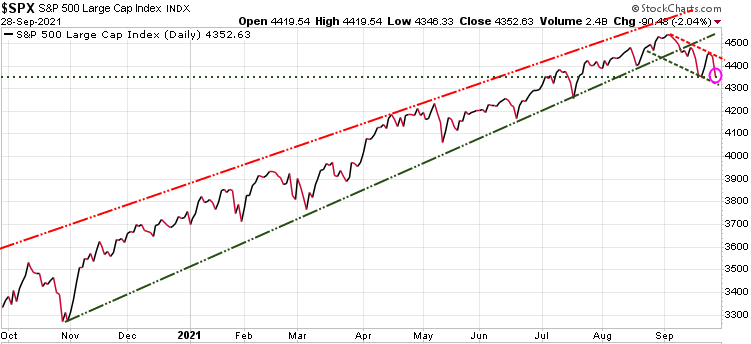
The Nasdaq Tech index closed out Tuesday’s regular session lower by 2.8%, posting its biggest drop since March. The S&P 500 and Dow also fell sharply.
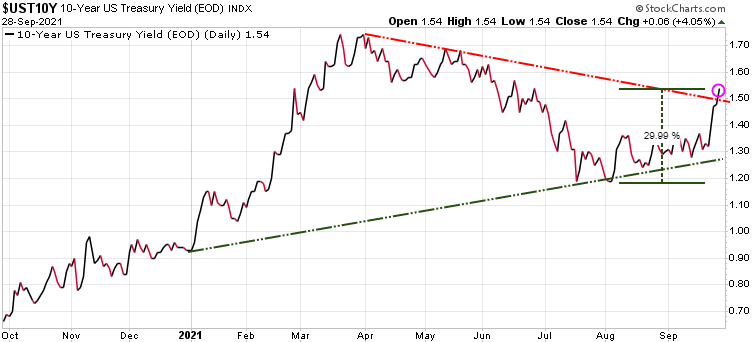
The decline in technology stocks came as Treasury yields rapidly rose to multi-month highs, with the swift move higher in borrowing costs pressuring valuations for growth and technology stocks. The yield on the benchmark 10-year note spiked to as much as 1.56%, or its highest level since June. The 10-year yield has also risen markedly over a relatively short period of time, gaining more than 16 basis points from its low from last Friday to its peak on Tuesday.
In Washington, lawmakers are racing to pass legislation to fund the government beyond the end of the fiscal year on Thursday. Republican lawmakers have balked at tying a continuing resolution to fund the government with a measure to raise the debt limit through the end of 2022, putting lawmakers at an impasse ahead of a Thursday night deadline to avert a shutdown. This also comes alongside ongoing debates around a bipartisan $1 trillion infrastructure deal and $3.5 trillion budget reconciliation package, with key actions on each of these also set to take place later this week.
The charts:
The Nasdaq composite index was the big loser today, down 423.29 or 2.83%.
The S&P 500 was down 90.48 or 2.04%.

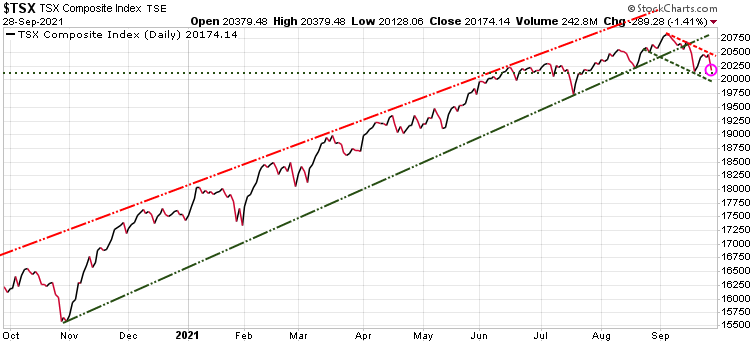
The Canadian TSX fared better thanks to commodities and energy moves, but still lost 289.28 or 1.41%.
The big reason for the declines in equities, especially the tech stocks was the rise in bond yields. With concerns of rising inflation, the US 10-year yield is up ~30% in the last two months.
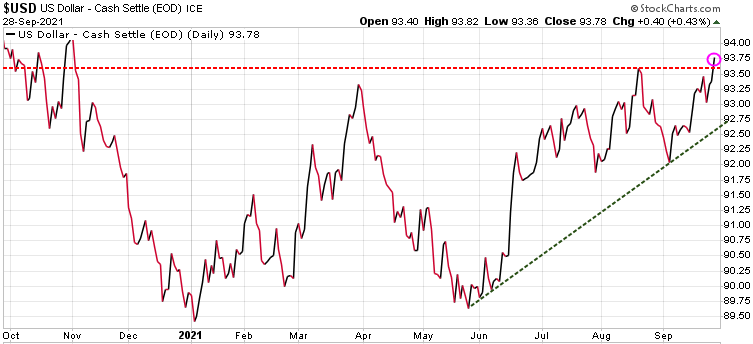
With rising inflation expectations the $US has also been rising.
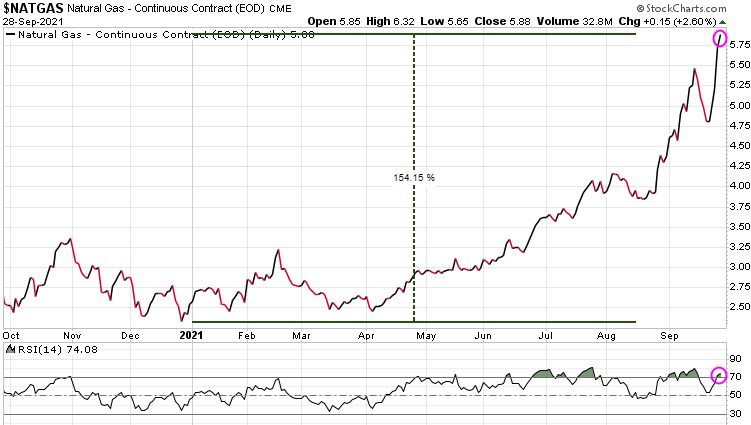
With the commodities, Natural Gas prices have rocketed higher, up over 150% since the start of the year.
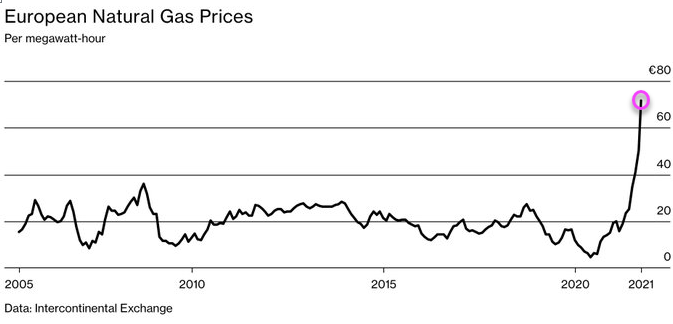
In Europe, Nat Gas prices are up almost 500%!
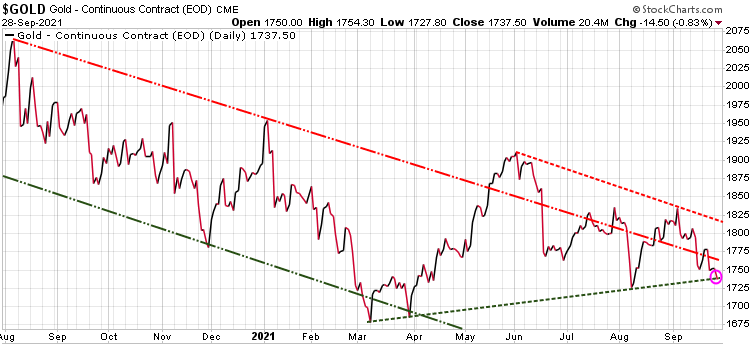
Gold continues its struggles, down another 14.50 today. The rising $US has been playing a big role in gold’s price since June.
Stay tuned!
Special Offers
| Service | Regular Price | Special Price | Saving | Subscribe |
|---|---|---|---|---|
| Trend Letter | $599.95 | 299.95 | $300 | Trend Letter $299.95 |
| Technical Trader | $649.95 | $324.95 | $325 | Trend Technical Trader $324.95 |
| Trend Disruptors | $599.95 | $299.95 | $300 | Trend Disruptors $299.95 |
| Better Deals | ||||
| Trend Letter + Technical Trader | $1,249.90 | $524.95 | $724.95 | Trend Letter + Technical Trader $524.95 |
| Trend Letter + Trend Disruptors | $1,199.90 | $503.95 | $695.95 | Trend Letter + Technical Trader $503.95 |
| Technical Trader + Trend Disruptors | $1,249.90 | $524.955 | $724.95 | Trend Disruptors + Technical Trader $524.95 |
| Best Deal | ||||
| Trend Suite: Trend Letter + Technical Trader + Trend Disruptors | $1,849.85 | $610.45 | $1,239.40 | Trend Suite TL =TTT + TD $610.45 |